Publicado in quantixed
Autor Stephen Royle

There are a few one-liners that I use in the shell to do some really nifty stuff. I struggle to quickly find and reuse these and asked for a solution on Mastodon.
There are a few one-liners that I use in the shell to do some really nifty stuff. I struggle to quickly find and reuse these and asked for a solution on Mastodon.

It’s been a while since I posted a breakdown of half marathon times. The last time seems to have been 2018. I decided to give my old code a clean-up and quickly crunched the numbers from the 2022 Kenilworth Half Marathon. First, the results: Briefly, the code below reads in a csv file of race results downloaded from the provider.

Quantifying the degree of colocalisation of two signals in microscopy images is very tricky. Lots has been written on this topic, including in my book The Digital Cell. The focus of this post is on visualising colocalisation . One way to look at colocalisation is two think about two sets of objects and how many of each set overlap. This is sometimes referred to as co-occupancy or object-based colocalisation .
Harnessing FAIR data is an event being held in London on September 3rd; no doubt all the speakers will espouse its virtues and speculate about how to realize its potential. ♥ Admirable aspirations indeed. Capturing hearts and minds also needs lots of real life applications!
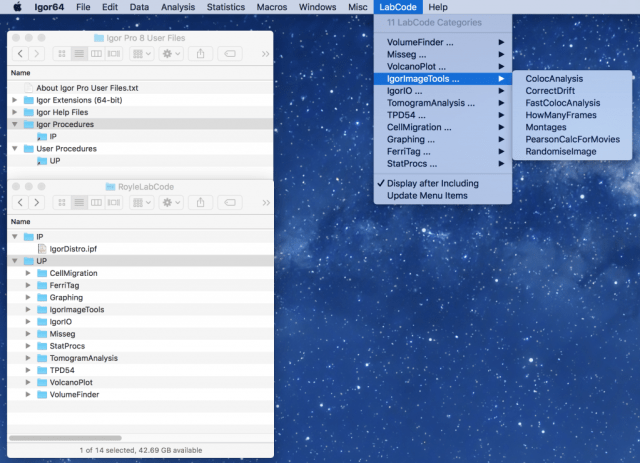
This post is something of a “how to” guide. The problem is how can you share code with a small team and keep it up-to-date? For ImageJ, the solution is simple. You can make an ImageJ update site and then push any updated code to the user when they startup ImageJ. For IgorPro, there is no equivalent. Typically I send ipf files to someone and they run the code, but I have to resend them whenever there’s an update.

This deserved a bit of further explanation, due to the stupidity involved. “Debugging is like being the detective in a crime movie where you are also the murderer.” – Filipe Fortes My code was giving an unexpected result and I was having a hard time figuring out the problem. The unexpected result was that a resampled set of 2D coordinates were not being rotated randomly.
I read about Antonio Sánchez Chinchón’s clever approach to use the Travelling Salesperson algorithm to generate some math-art in R. The follow up was even nicer in my opinion, Pencil Scribbles. The subject was Boris Karloff as the monster in Frankenstein. I was interested in running the code (available here and here), so I thought I’d run it on a famous scientist.

A large amount of time doing data analysis is the process of cleaning, importing, reorganising and generally not actually analysing data but getting it ready to analyse. I’ve been trying to get over the idea to non-coders in the group that strict naming conventions (for example) are important and very helpful to the poor person who has to deal with the data.

This is part-tip, part-adventures in code. I found out recently that it is possible to comment out multiple lines of code in Igor and thought I’d put this tip up here.

This is a quick post about the punch card feature on GitHub. This is available from Graphs within each repo and is also directly accessible via the API. I was looking at the punch card for two of my projects: one is work related and the other, more of a kind of hobby. The punch cards were different (the work one had way more commits, 99, than the hobby, 22). There was an interesting pattern to them. Here they are overlaid.