Informatique et sciences de l'informationAnglaisHugo

rOpenSci - open tools for open science

rOpenSci - open tools for open science
Open Tools and R Packages for Open Science
Page d'accueilFlux JSON
language
Publié
Auteurs Scott Chamberlain, Noam Ross

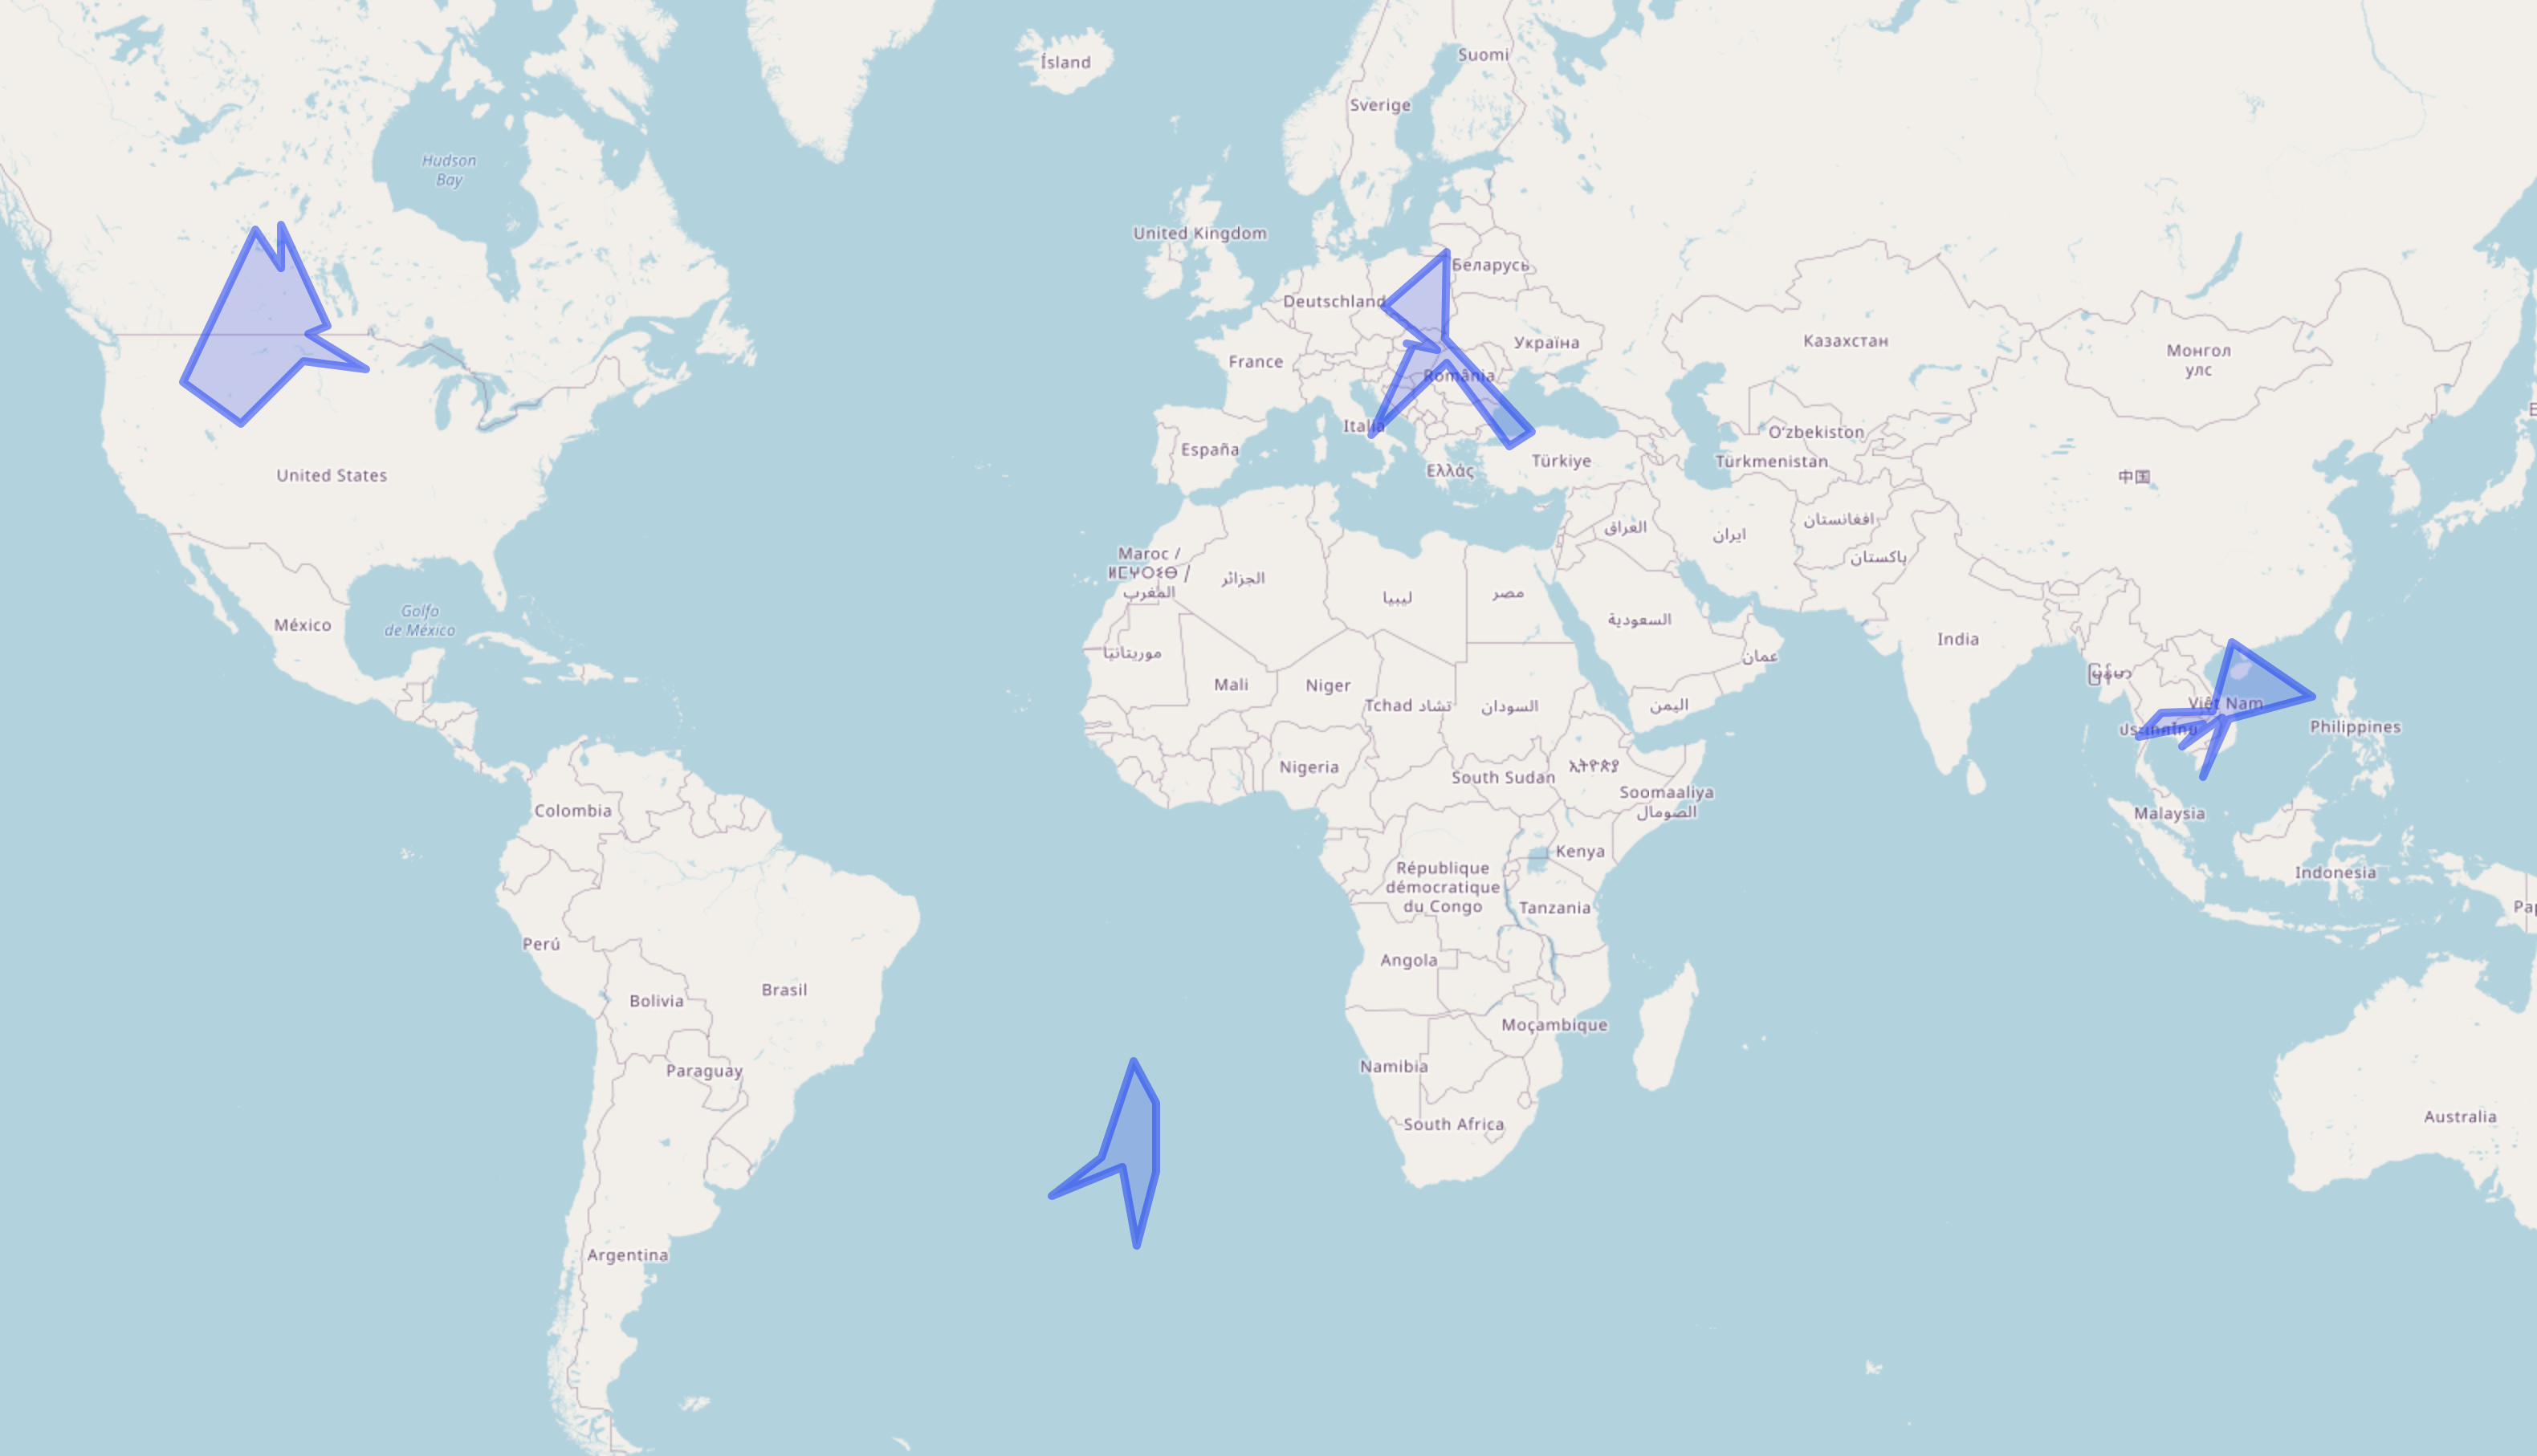
randgeo generates random points and shapes in GeoJSON and WKT formats foruse in examples, teaching, or statistical applications. Points and shapes are generated in the long/lat coordinate system and withappropriate spherical geometry; random points are distributed evenly acrossthe globe, and random shapes are sized according to a maximum great-circledistance from the center of the shape.

Publié
Auteur Scott Chamberlain

I’ve recently released the new package ccafs, which provides accessto data from Climate Change, Agriculture and Food Security(CCAFS; http://ccafs-climate.org/) General Circulation Models (GCM) data.GCM’s are a particular type of climate model, used for weather forecasting,and climate change forecasting - read more athttps://en.wikipedia.org/wiki/General_circulation_model.

Publié
Auteur Scott Chamberlain

Previously on this blog we have discussed making geojson maps and uploading to Github for interactive visualization with USGS BISON data, and with GBIF data, and on my own personal blog. This is done using a file format called geojson , a file format based on JSON (JavaScript Object Notation) in which you can specify geographic data along with any other metadata.

Publié
Auteur Scott Chamberlain

Previously on this blog and on my own personal blog, I have discussed how easy it is to create interactive maps on Github using a combination of R, git and Github. This is done using a file format called geojson , a file format based on JSON (JavaScript Object Notation) in which you can specify geographic data along with any other metadata.

Publié
Auteur Scott Chamberlain

We have a number of packages for getting species occurrence data: rgbif and rbison. The power of R is that you can pull down this occurrence data, manipulate the data, do some analyses, and visualize the data - all in one open source framework. However, when dealing with occurrence data on maps, it is often useful to be able to interact with the visualization.