Informatique et sciences de l'informationAnglaisHugo

rOpenSci - open tools for open science

rOpenSci - open tools for open science
Open Tools and R Packages for Open Science
Page d'accueilFlux JSON
language
Publié
Auteur Nicholas Tierney

In late November 2018, we ran the third annual rOpenSci ozunconf. This is the sibling rOpenSci unconference, held in Australia. We ran the first ozunconf in Brisbane in 2016, and the second in Melbourne in 2017. Photos taken by Ajay from Fotoholics As usual, before the unconf, we started discussion on GitHub issue threads,and the excitement was building with the number of issues.

Publié
Auteur April Wright

I never really thought I would write an R package. I use R pretty casually. Then, this year, I was invited to participate during the last week of the Analytical Paleobiology short course, an intensive month-long experience in quantitative paleontology. I was thrilled to be invited.

Publié
Auteurs Alec Robitaille, Quinn Webber, Eric Vander Wal

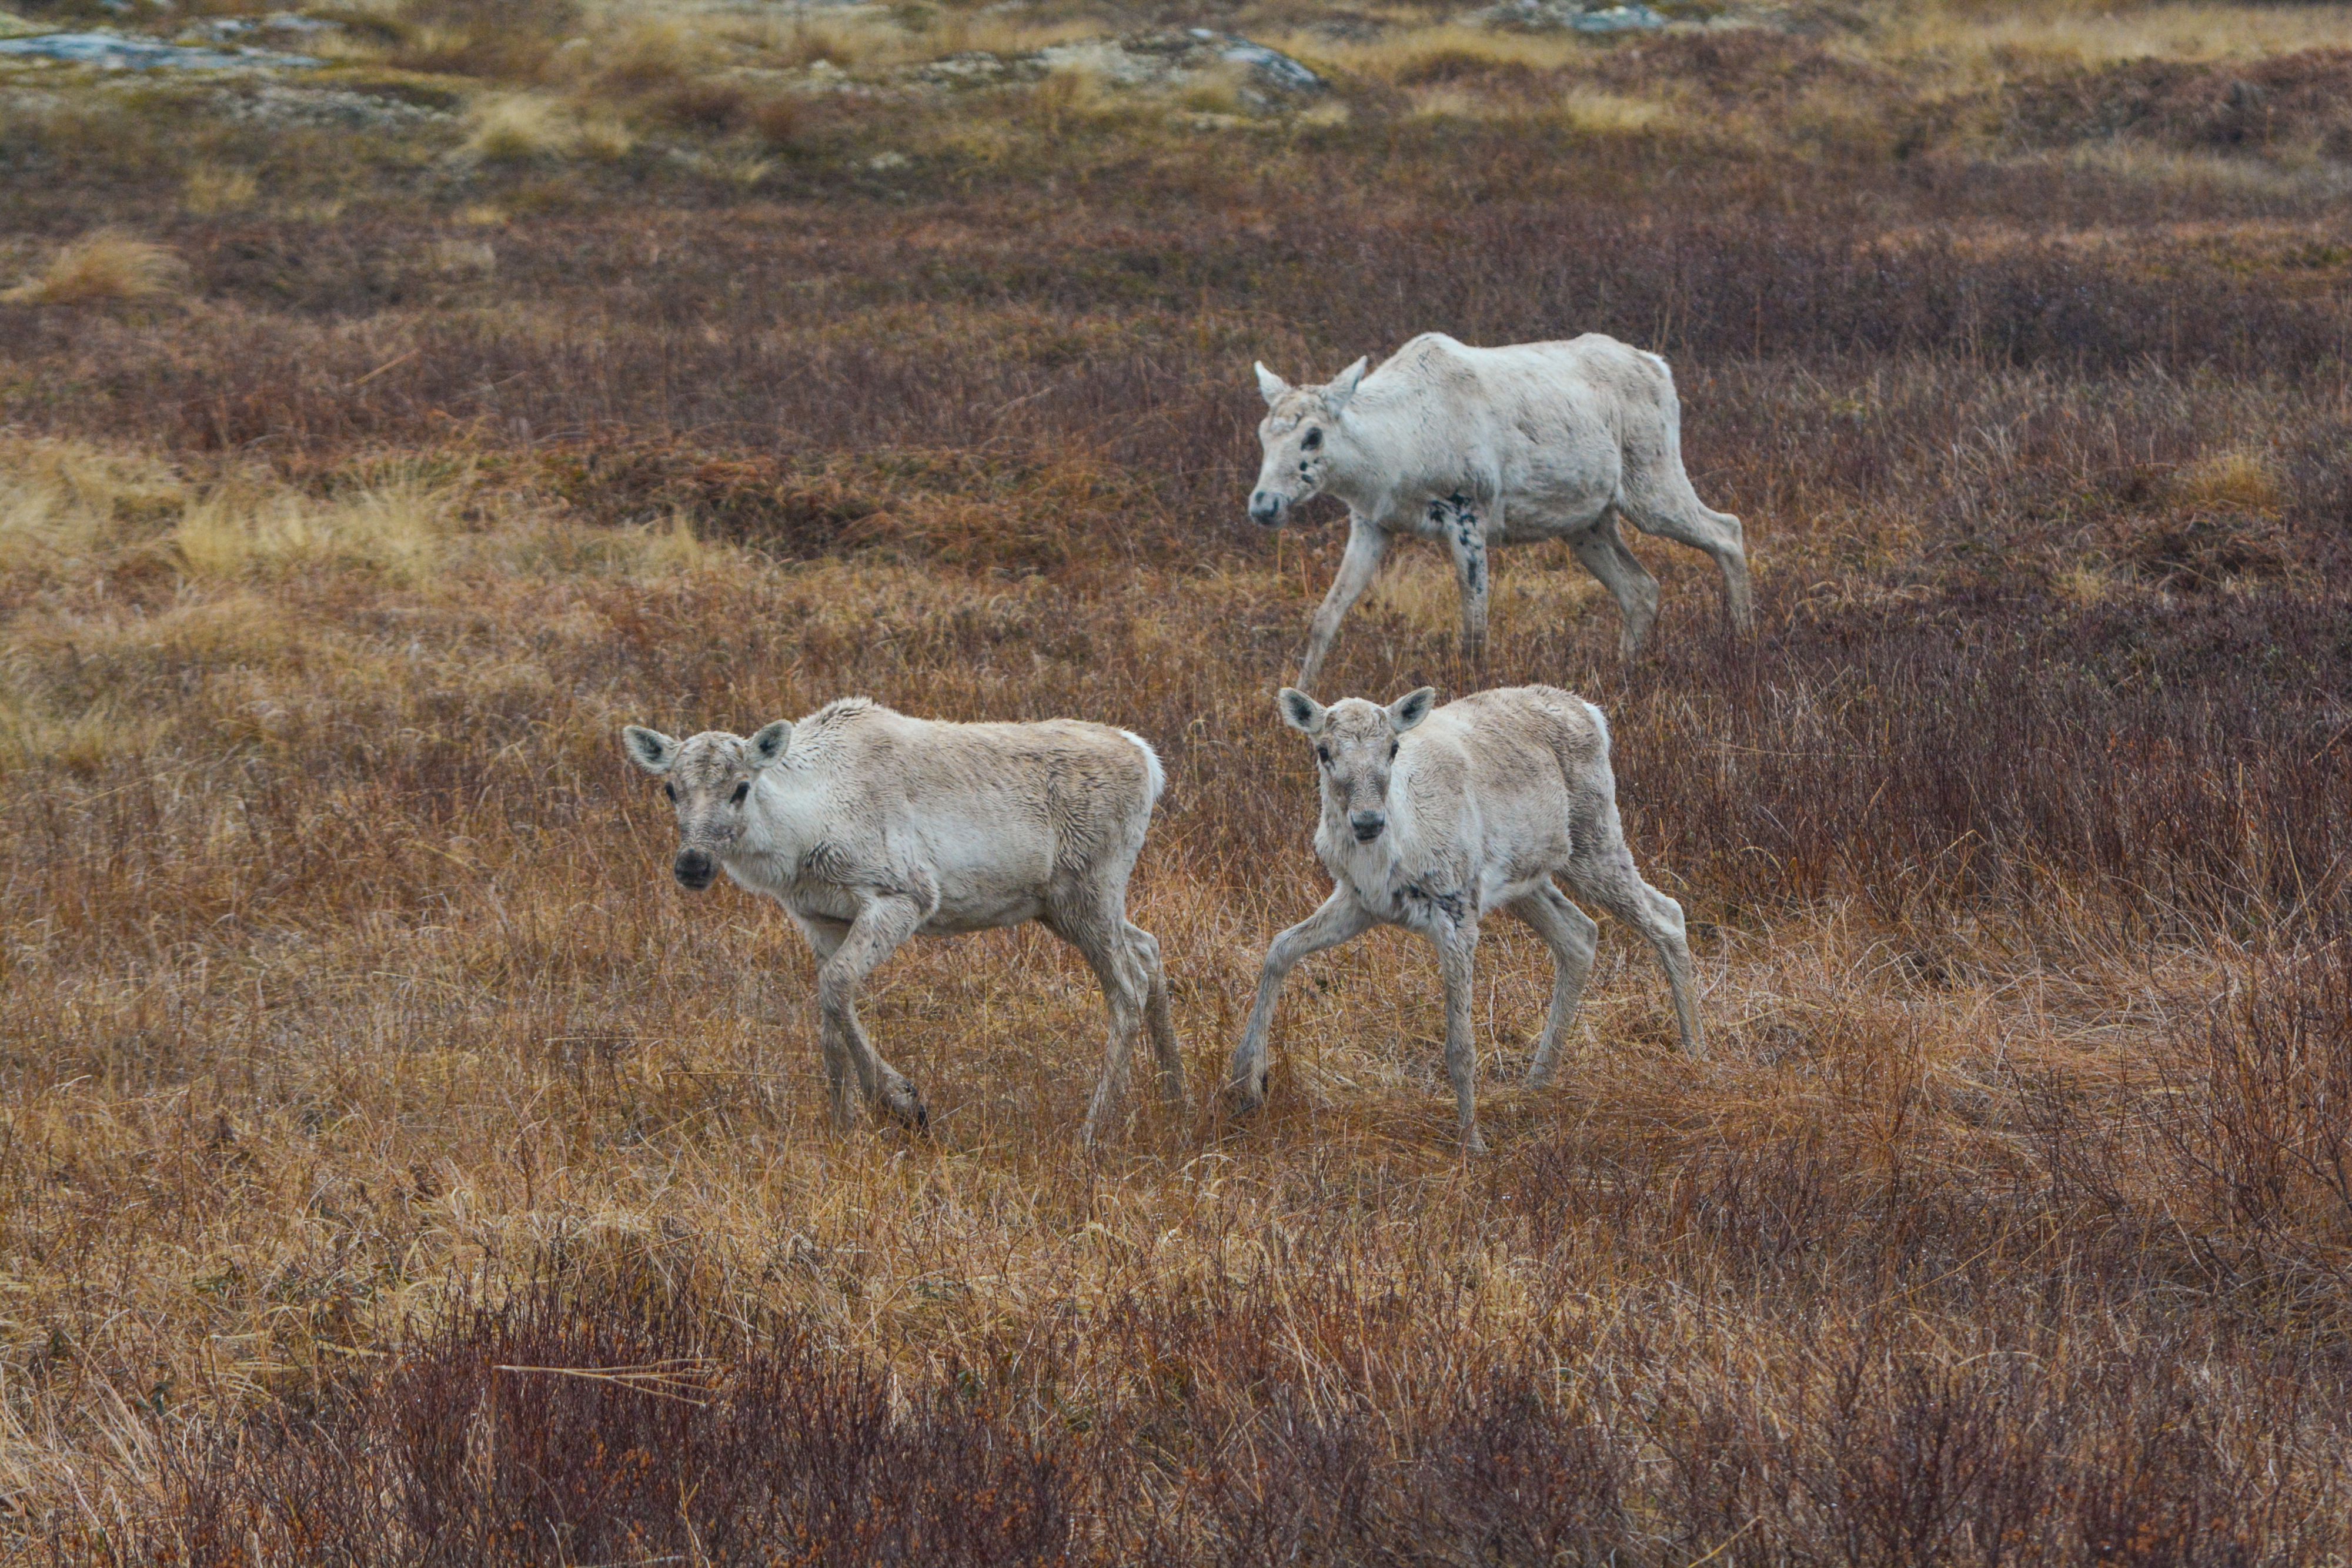
spatsoc is an R package written by Alec Robitaille, Quinn Webber and Eric Vander Wal of the Wildlife Evolutionary Ecology Lab (WEEL) at Memorial University of Newfoundland. It is the lab’s first R package and was recently accepted through the rOpenSci onboarding process with a big thanks to reviewers Priscilla Minotti and Filipe Teixeira, and editor Lincoln Mullen.

Publié
Auteur Dom Bennett

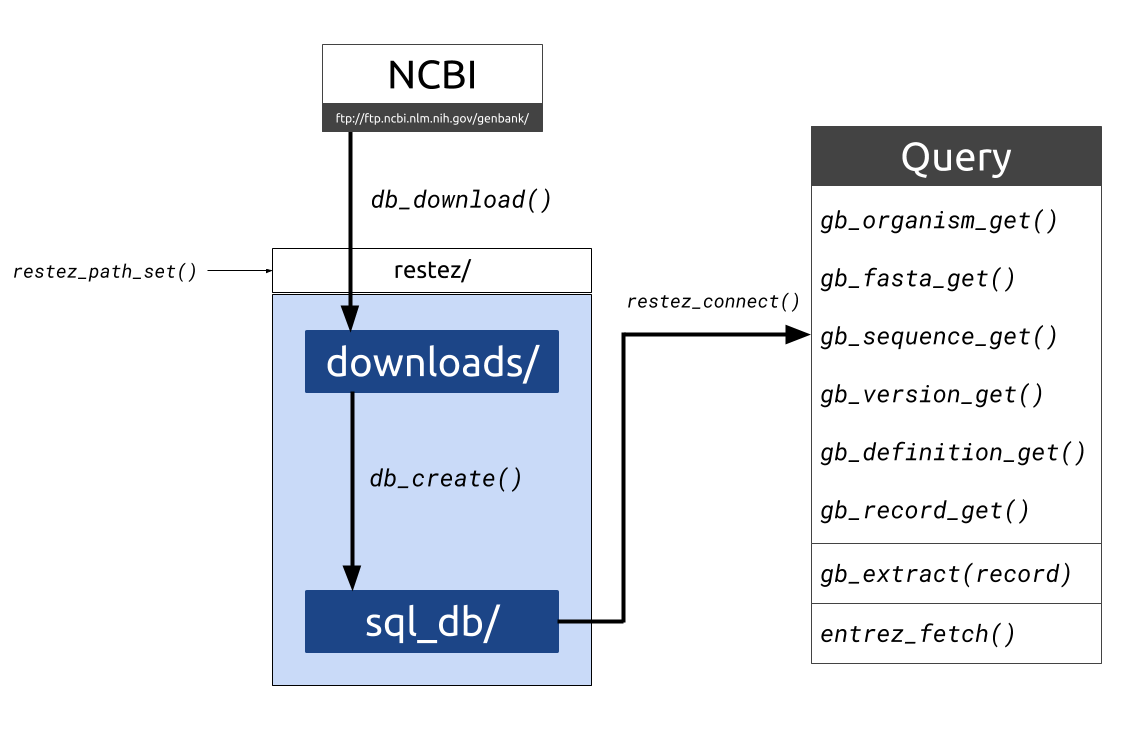
What is restez? R packages for interacting with the National Center for Biotechnology Information (NCBI) have, to-date, depended on API query calls via NCBI’s Entrez.For computational analyses that require the automated look-up of reams of biological sequence data, piecemeal querying via bandwith-limited requests is evidently not ideal.

Publié
Auteurs Ben Raymond, Michael Sumner

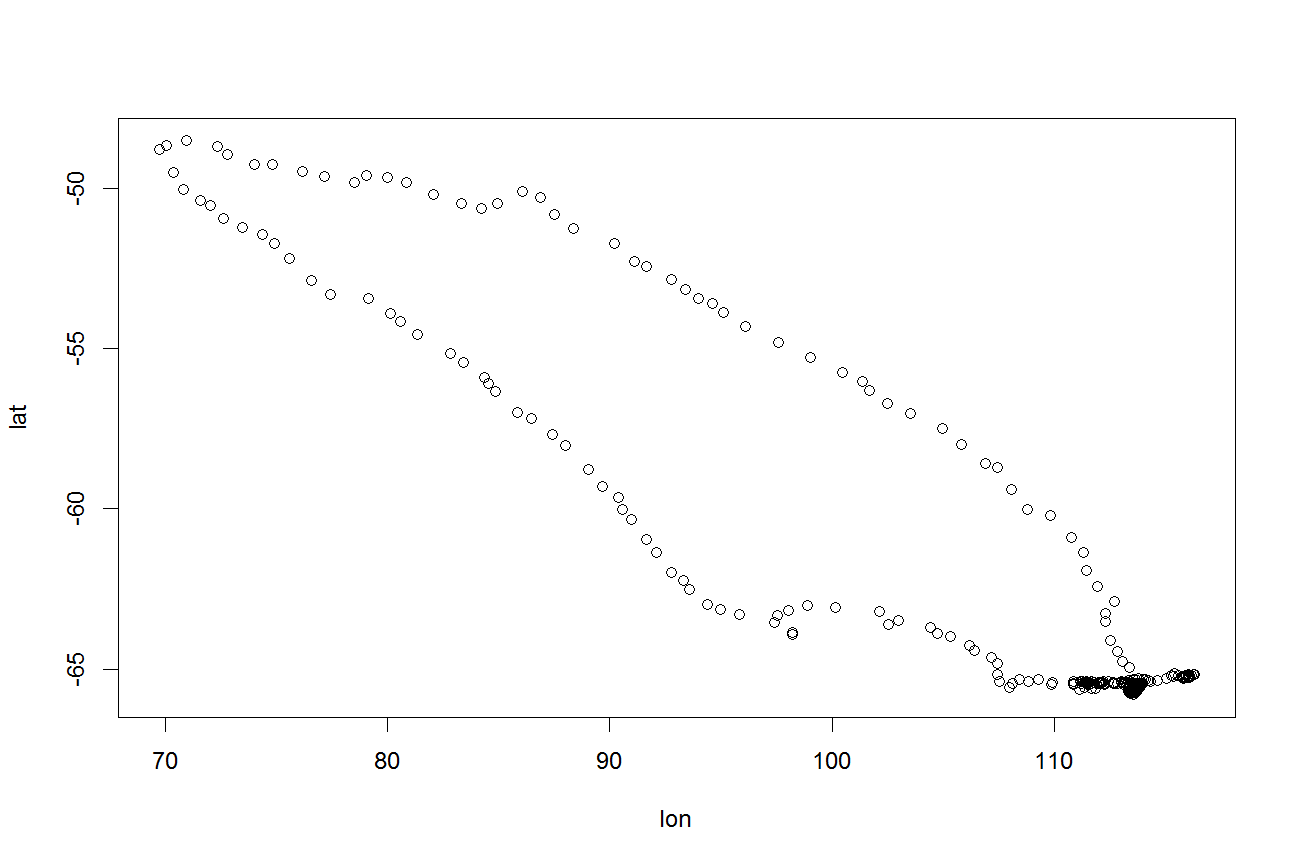
Antarctic/Southern Ocean science and rOpenSci Collaboration and reproducibility are fundamental to Antarctic and Southern Ocean science, and the value of data to Antarctic science has long been promoted. The Antarctic Treaty (which came into force in 1961) included the provision that scientific observations and results from Antarctica should be openly shared.

Publié
Auteur Rafael Pilliard Hellwig

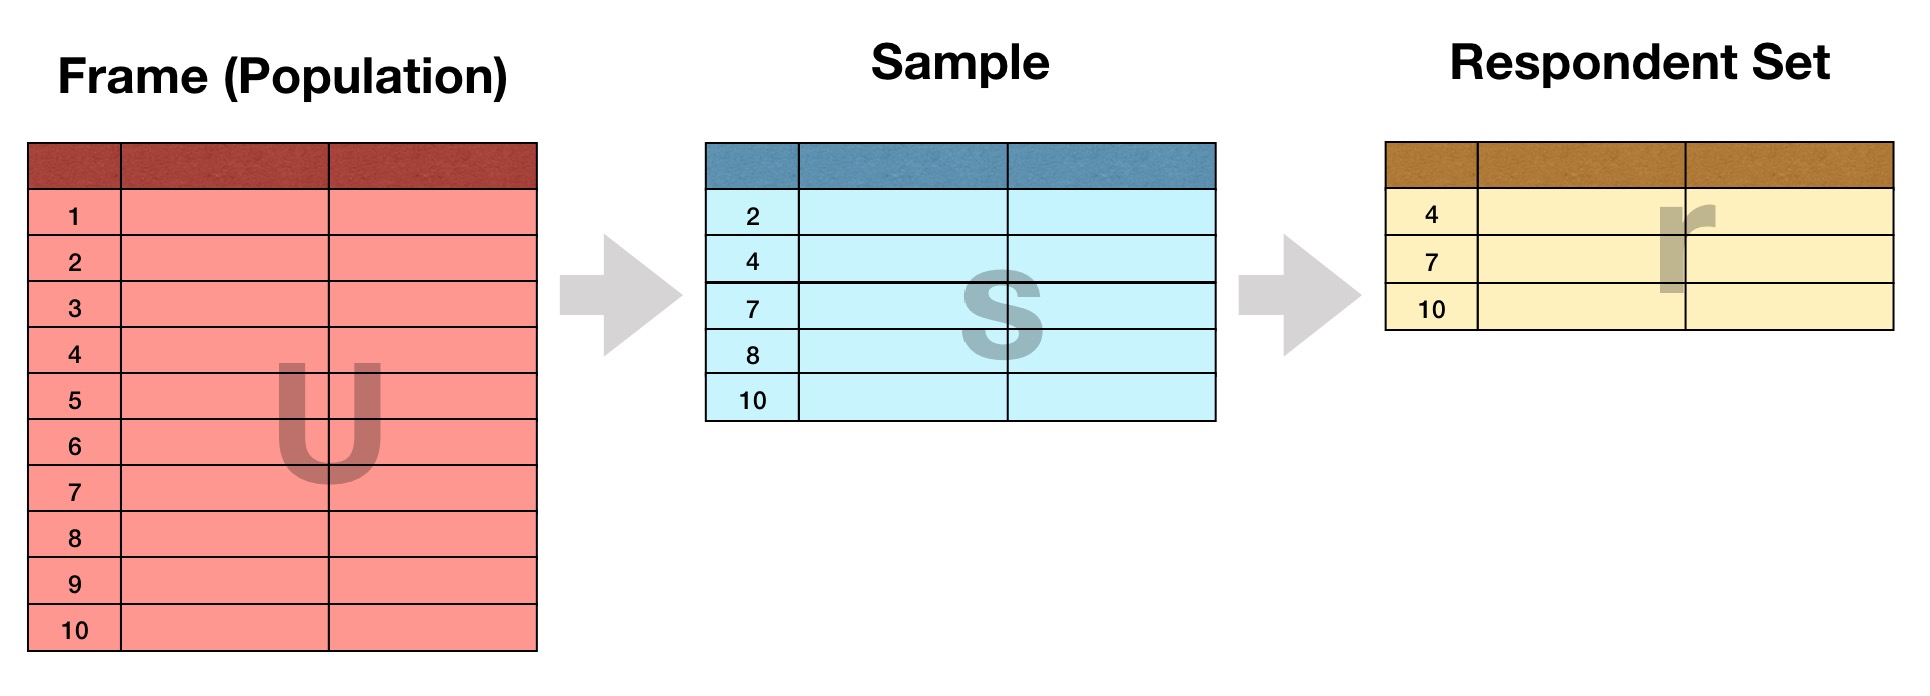
Background Surveys are ubiquitous in the social sciences, and the best of them are meticulously planned out. Statisticians often decide on a sample size based on a theoretical design, and then proceed to inflate this number to account for “sample losses”. This ensures that the desired sample size is achieved, even in the presence of non-response.

Publié
Auteur Max Joseph

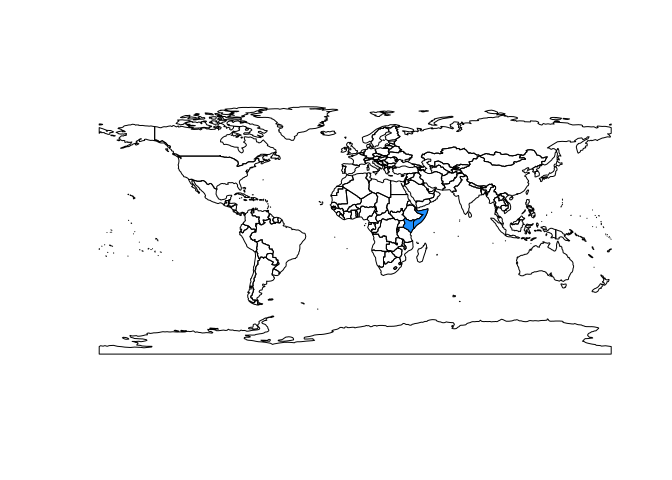
Hundreds of thousands of people in east Africa have been displaced and hundreds have died as a result of torrential rains which ended a drought but saturated soils and engorged rivers, resulting in extreme flooding in 2018.This post will explore these events using the R package smapr, which provides access to global satellite-derived soil moisture data collected by the NASA Soil Moisture Active-Passive (SMAP) mission and abstracts away some of

Publié
Auteur Greg Finak

Sharing data sets for collaboration or publication has always been challenging, but it’s become increasingly problematic as complex and high dimensional data sets have become ubiquitous in the life sciences. Studies are large and time consuming; data collection takes time, data analysis is a moving target, as is the software used to carry it out.

Publié
Auteur Dom Bennett

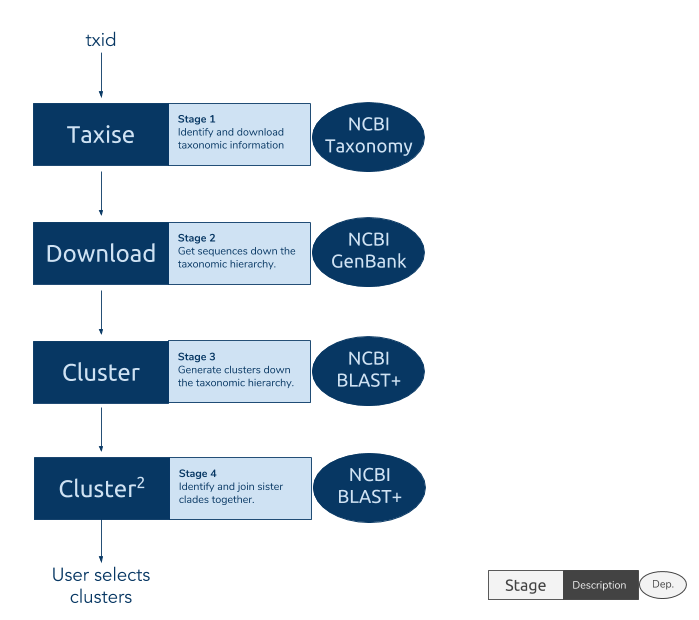
In this technote I will outline what phylotaR was developed for, how to install it and how to run it with some simple examples.What is phylotaR? In any phylogenetic analysis it is important to identify sequences that share the same orthology – homologous sequences separated by speciation events. This is often performed by simply searching an online sequence repository using sequence labels.

Publié
Auteur Matthew Strimas-Mackey

eBird is an online tool for recording birdobservations. The eBird database currently contains over 500 millionrecords of bird sightings, spanning every country and nearly every birdspecies, making it an extremely valuable resource for bird research andconservation. These data can be used to map the distribution andabundance of species, and assess how species’ ranges are changing overtime. This dataset is available for download as a text file;