Creating an RSS feed for your Quarto blog can be tricky, but there’s one essential detail that can save you a lot of frustration: matching your file names correctly. The Key to Success: Matching Names When configuring your RSS feed in the _quarto.yml file, ensure that the name you use for the RSS icon matches the name of your listing file. This might seem minor, but it’s crucial for your RSS feed to work properly.
Data & Molecule Bits

As scientists and data analysts, we often encounter complex curves in our work. These could be spectroscopic data, chromatograms, or any other type of signal that appears as a single peak but might be composed of multiple underlying components. The process of breaking down such a curve into its constituent parts is known as curve deconvolution or peak fitting.
Excel non è un Database: Linee Guida Essenziali per una Corretta Gestione dei Dati È fondamentale comprendere la differenza tra un foglio di calcolo e un database, nonché l’importanza di una corretta gestione dei dati. Di seguito sono riportati motivi per cui Excel non dovrebbe essere utilizzato come database, insieme a criteri essenziali per gestire e analizzare i dati in modo efficace.

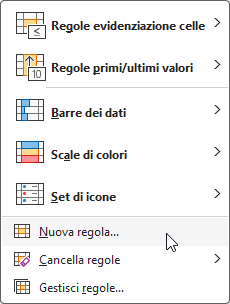
Formattazione Condizionale La formattazione condizionale in Excel consente di applicare automaticamente stili di formattazione (come colori delle celle, stili di carattere o bordi) alle celle in base a determinate condizioni o criteri specifici.
Confronto tra Excel e Database nella Gestione Clinica dei Dati: Errori e Sicurezza Caso Excel: Errore nel Valore di una Glicemia Un errore comune in Excel è l’inserimento di valori non corretti a causa di formati non standardizzati. Supponiamo di avere una tabella in cui si registrano i valori di glicemia dei pazienti.
Non-Negotiables for Your Data In today’s data-driven world, it is essential to understand the difference between a spreadsheet and a database, as well as the importance of proper data management. This post will explain why Excel should not be used as a database and provide key guidelines for effectively managing and analyzing data.
List of packages I’ve found useful in my workflow during 2024 (so far) Plot spiralize: Visualize Data on Spirals tags : #plot [cran package link] https://CRAN.R-project.org/package=spiralize description from the author/vignette panelView: Visualizing Panel Data tags : #plot [cran package link] https://CRAN.R-project.org/package=panelView description from the
Pizza, a beloved culinary delight, comes in various sizes. To better understand the implications of pizza size on the amount of pizza consumed, we establish a new standard unit called the standard pizza radius , denoted by the letter , which measures 6 inches. This article examines how the area of a pizza changes with size and demonstrates that one extra-large pizza can provide more pizza than two standard-sized pizzas.

Embark on a journey into the realm of Dungeons & Dragons as we unravel a captivating fiddle riddle involving a dice duel. Using the power of the R programming language and the Monte Carlo simulation method, we’ll simulate the outcomes of duels between two players, each armed with a bag containing six distinct DnD dice. Prepare to explore the fascinating world of probability and randomness!

In this blog post, we’ll delve into the realm of casino roulette and use R simulations to estimate the frequency of the number 0 appearing over the span of a year (40 spins per hour x 24 hours x 365 days) . Roulette, a classic casino game, is known for its unpredictability, making it an interesting subject for probability exploration.