RData VisualizationAccessibilityHighcharterHighchartsScienze informatiche e dell'informazioneInglese
Pubblicato in dataand.me
Autore Mara Averick

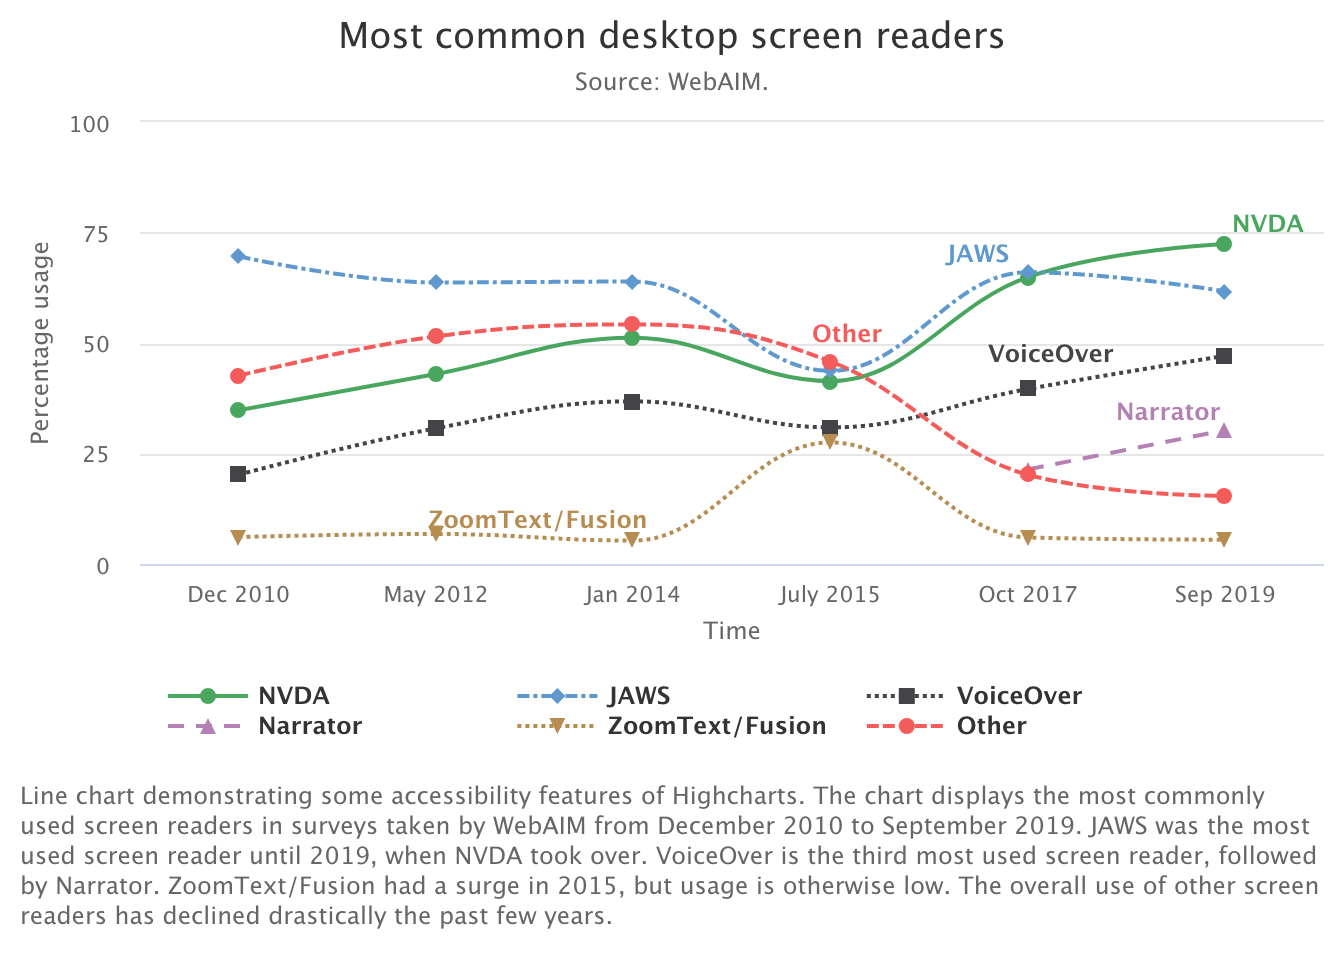
Today we’ll be using the Joshua Kunst’s {highcharter} package to re-create the first example from the Highcharts documentation for its accessibility module, an accessible line chart showing screen reader popularity over time, as an htmlwidget.