A group of researchers from the German N² network presents the results of a survey among PhD students on the abuse of power in science and outlines ways to counter it

A group of researchers from the German N² network presents the results of a survey among PhD students on the abuse of power in science and outlines ways to counter it

Our lab is growing! In our Three Questions series, we’re profiling each of our members and the amazing work they’re doing. Today’s post features Asura Enkhbayar, a PhD student and data scientist at the ScholCommLab.
The course “Visualising Science Using VOSviewer” VOSviewer was developed to construct various networks based on scientific literature. One type of maps is co-occurrence networks of essential terms. They provide an overview of the topics in the publications. Other networks are bibliometric; they are based on co-authorship or citations.

Over the past month, I participated in a workshop led by Cassie Evans and Smashing Magazine called "The SVG Animation Masterclass". It was a fantastic workshop and inspires me to do more with animations for liberate science designs in the future. Watch this space, but until then, here's some things I wanted to share with you about my journey into animated SVGs.

In this blog post, Andrea Whiteley summarizes key findings and recommendations from her research with more than 100 participating Community Scholars.
In a previous post the SEP 2021-2027 was introduced. As a reminder: the Association of Universities in the Netherlands (VSNU), the Netherlands Organisation for Scientific Research (NWO) and the Royal Netherlands Academy of Arts and Sciences (KNAW) share the responsibility for the evaluation of all academic research units. According to the SEP 2021-2027, research units are evaluated in the light of their context, aims and strategy.

Our lab is growing! In our Three Questions series, we’re profiling each of our members and the amazing work they’re doing. Today, we’re highlighting Alyssa Jeffrey, a first year master’s student in the School of Information Studies at the University of Ottawa and a research assistant at the ScholCommLab.

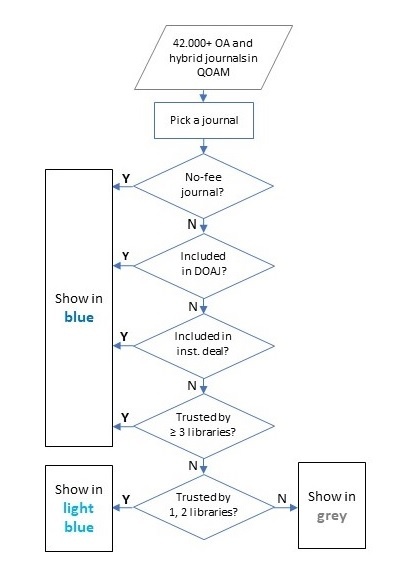
A recent item in Nature News reports “Hundreds of ‘predatory’ journals indexed on leading scholarly database” , sub-headed “[…] the analysis highlights how poor-quality science is infiltrating literature.” A year before, a group of leading scholars and publishers already warned in a comment in Nature, "So far, disparate attempts to address predatory publishing have been unable to control this ever-multiplying problem.

Every 28th of the month, we release a new version of Hypergraph — we just released Hypergraph (Beta) v0.10.0 🎉 (if you already have it installed, it'll auto-update next time you run it). Below, you can find a detailed and human-readable version of everything that's changed since last months release (v0.9.0). Added Markdown rendering in Hypergraph (includes equation rendering, table rendering) — main files that are markdown files will now be

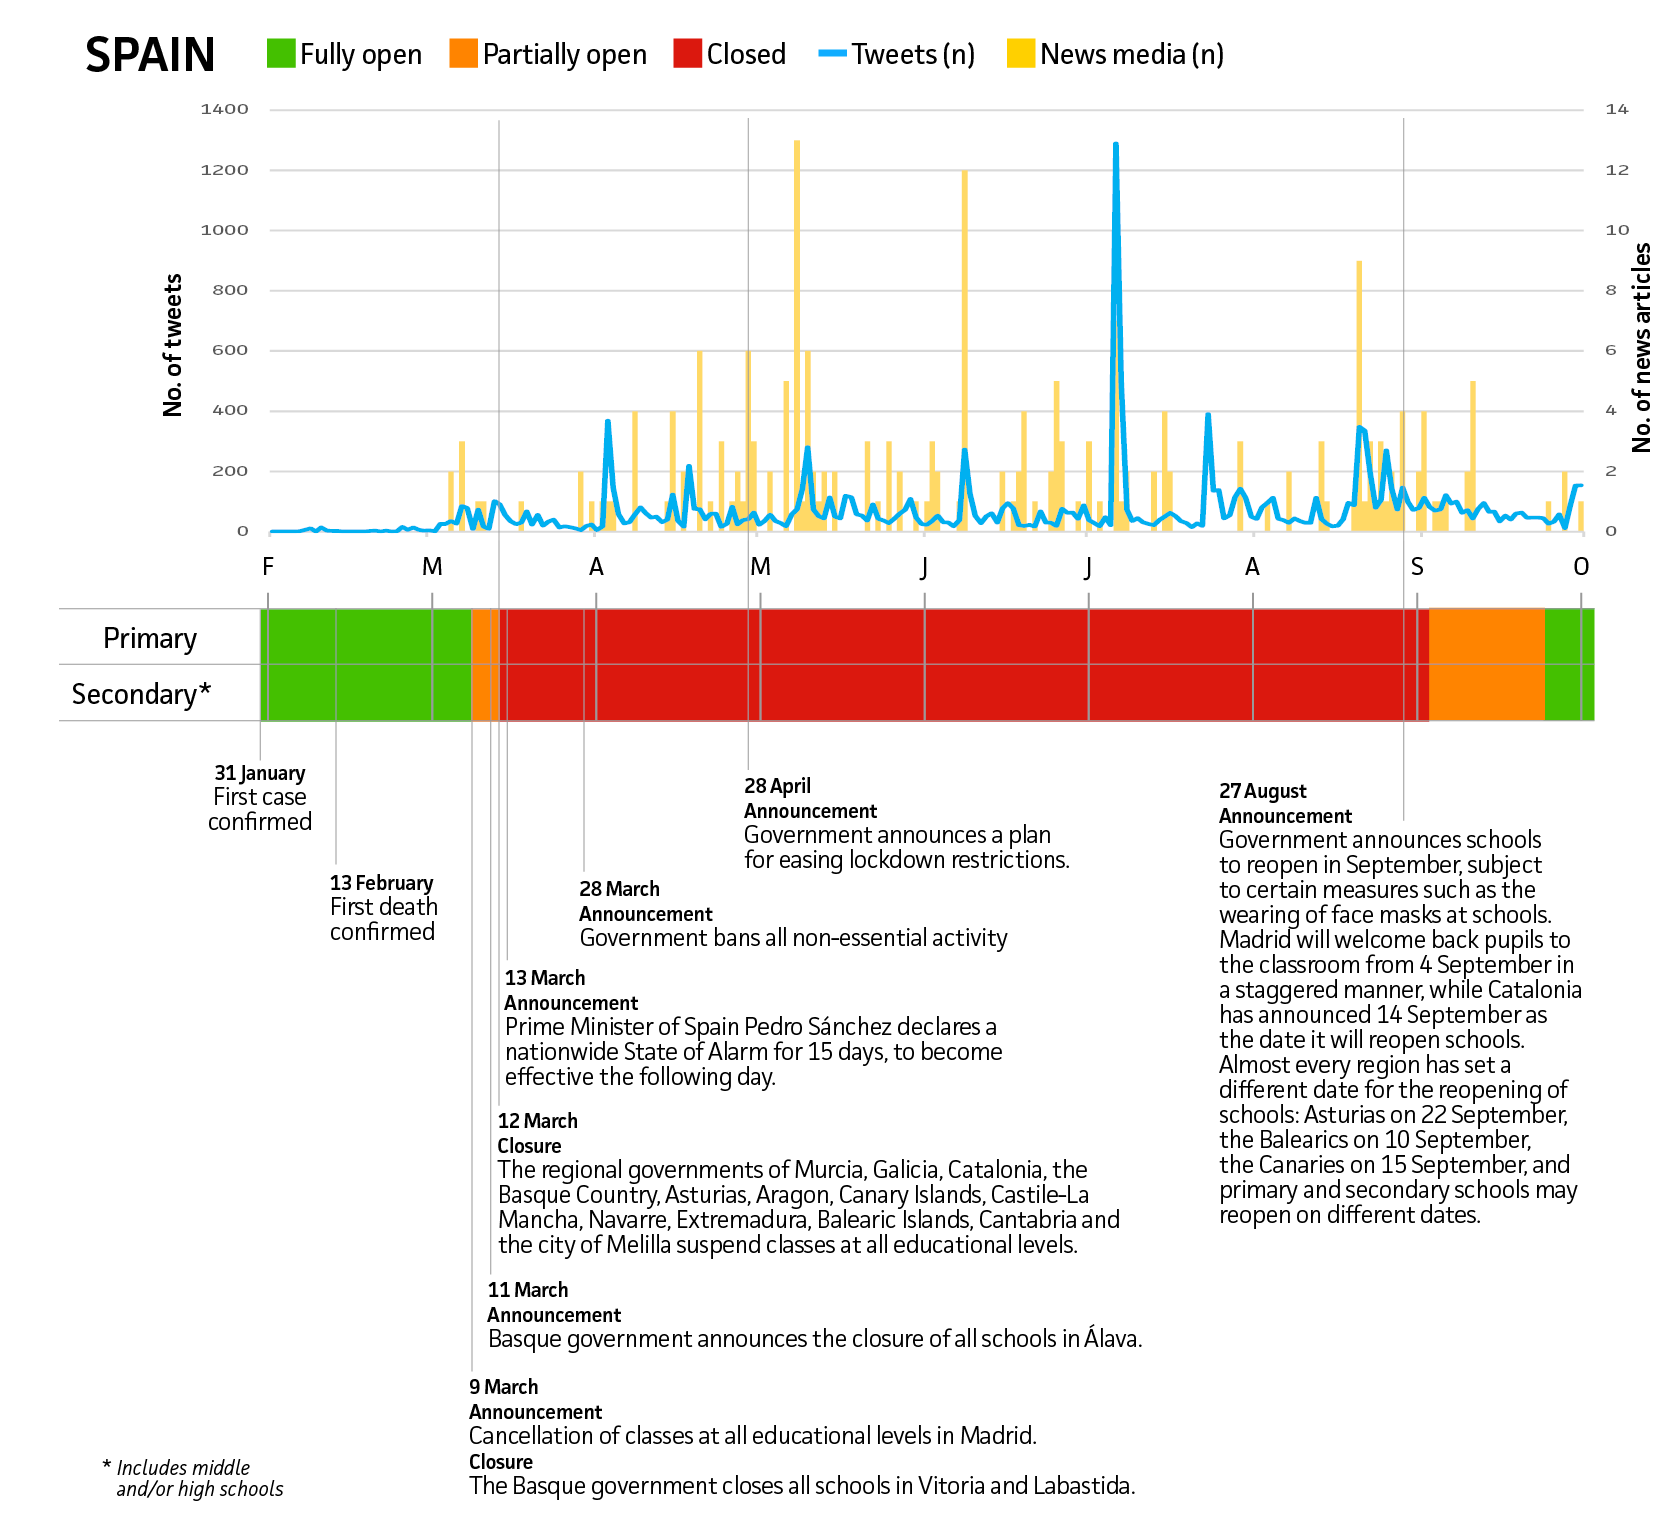
One of the many puzzles of the COVID-19 pandemic has been the extent to which children are vulnerable to and spreaders of the virus. Fewer infection rates have been reported in children compared with adults, as have milder symptoms. But the infection rate in children is biased, given the testing policies in many countries.