What is the best music to listen to while writing a manuscript or grant proposal? OK, I know that some people prefer silence and certainly most people hate radio chatter while trying to concentrate. However, if you like listening to music, setting an iPod on shuffle is no good since a track by Napalm Death can jump from the speakers and affect your concentration.
Messaggi di Rogue Scholar

I was looking at the latest issue of Cell and marvelling at how many authors there are on each paper. It’s no secret that the raison d’être of Cell is to publish the “last word” on a topic (although whether it fulfils that objective is debatable). Definitive work needs to be comprehensive. So it follows that this means lots of techniques and ergo lots of authors.

This post is about metrics and specifically the H-index. It will probably be the first of several on this topic. I was re-reading a blog post by Alex Bateman on his affection for the H-index as a tool for evaluating up-and-coming scientists.

What was the best year in music? OK, I have to be upfront and say that I thought the answer to this would be 1991. Why? Just a hunch. Nevermind, Loveless, Spiderland, Laughing Stock… it was a pretty good year. I thought it would be fun to find out if there really was a golden year in music. It turns out that it wasn’t 1991.

A recent opinion piece published in eLife bemoaned the way that citations are used to judge academics because we are not even certain of the veracity of this information. The main complaint was that Google Scholar – a service that aggregates citations to articles using a computer program – may be less-than-reliable. There are three main sources of citation statistics: Scopus, Web of Knowledge/Science and Google Scholar;

How long does it take to publish a paper? The answer is – in our experience, at least – about 9 months. That’s right, it takes about the same amount of time to have a baby as it does to publish a scientific paper. Discussing how we can make the publication process quicker is for another day. Right now, let’s get into the numbers.

Fans of data visualisation will know the work of Edward Tufte well. His book “The Visual Display of Quantitative Information” is a classic which covers the history and the principals of conveying data in a concise way, that is easy to interpret. He is also credited with two different dataviz techniques: sparklines and image quilts.
In the lab we use IgorPro from Wavemetrics for analysis. Here is a useful procedure to plot all XY pairs in an experiment. I was plotting out some cell tracking data with a colleague and I knew that I had this useful function buried in an experiment somewhere. I eventually found it and thought I’d post it here.

I thought I would start add a blog to our lab website. The plan is to update maybe once a week with content that is too long for twitter but doesn’t fit in the categories on the lab website. I’m thinking extra analysis, paper commentaries, outreach activities etc. Let’s see how it goes. First up: how do you count the number of words or characters in a text file? Microsoft Word has a nice feature for doing this, but poor old TextEdit does not.

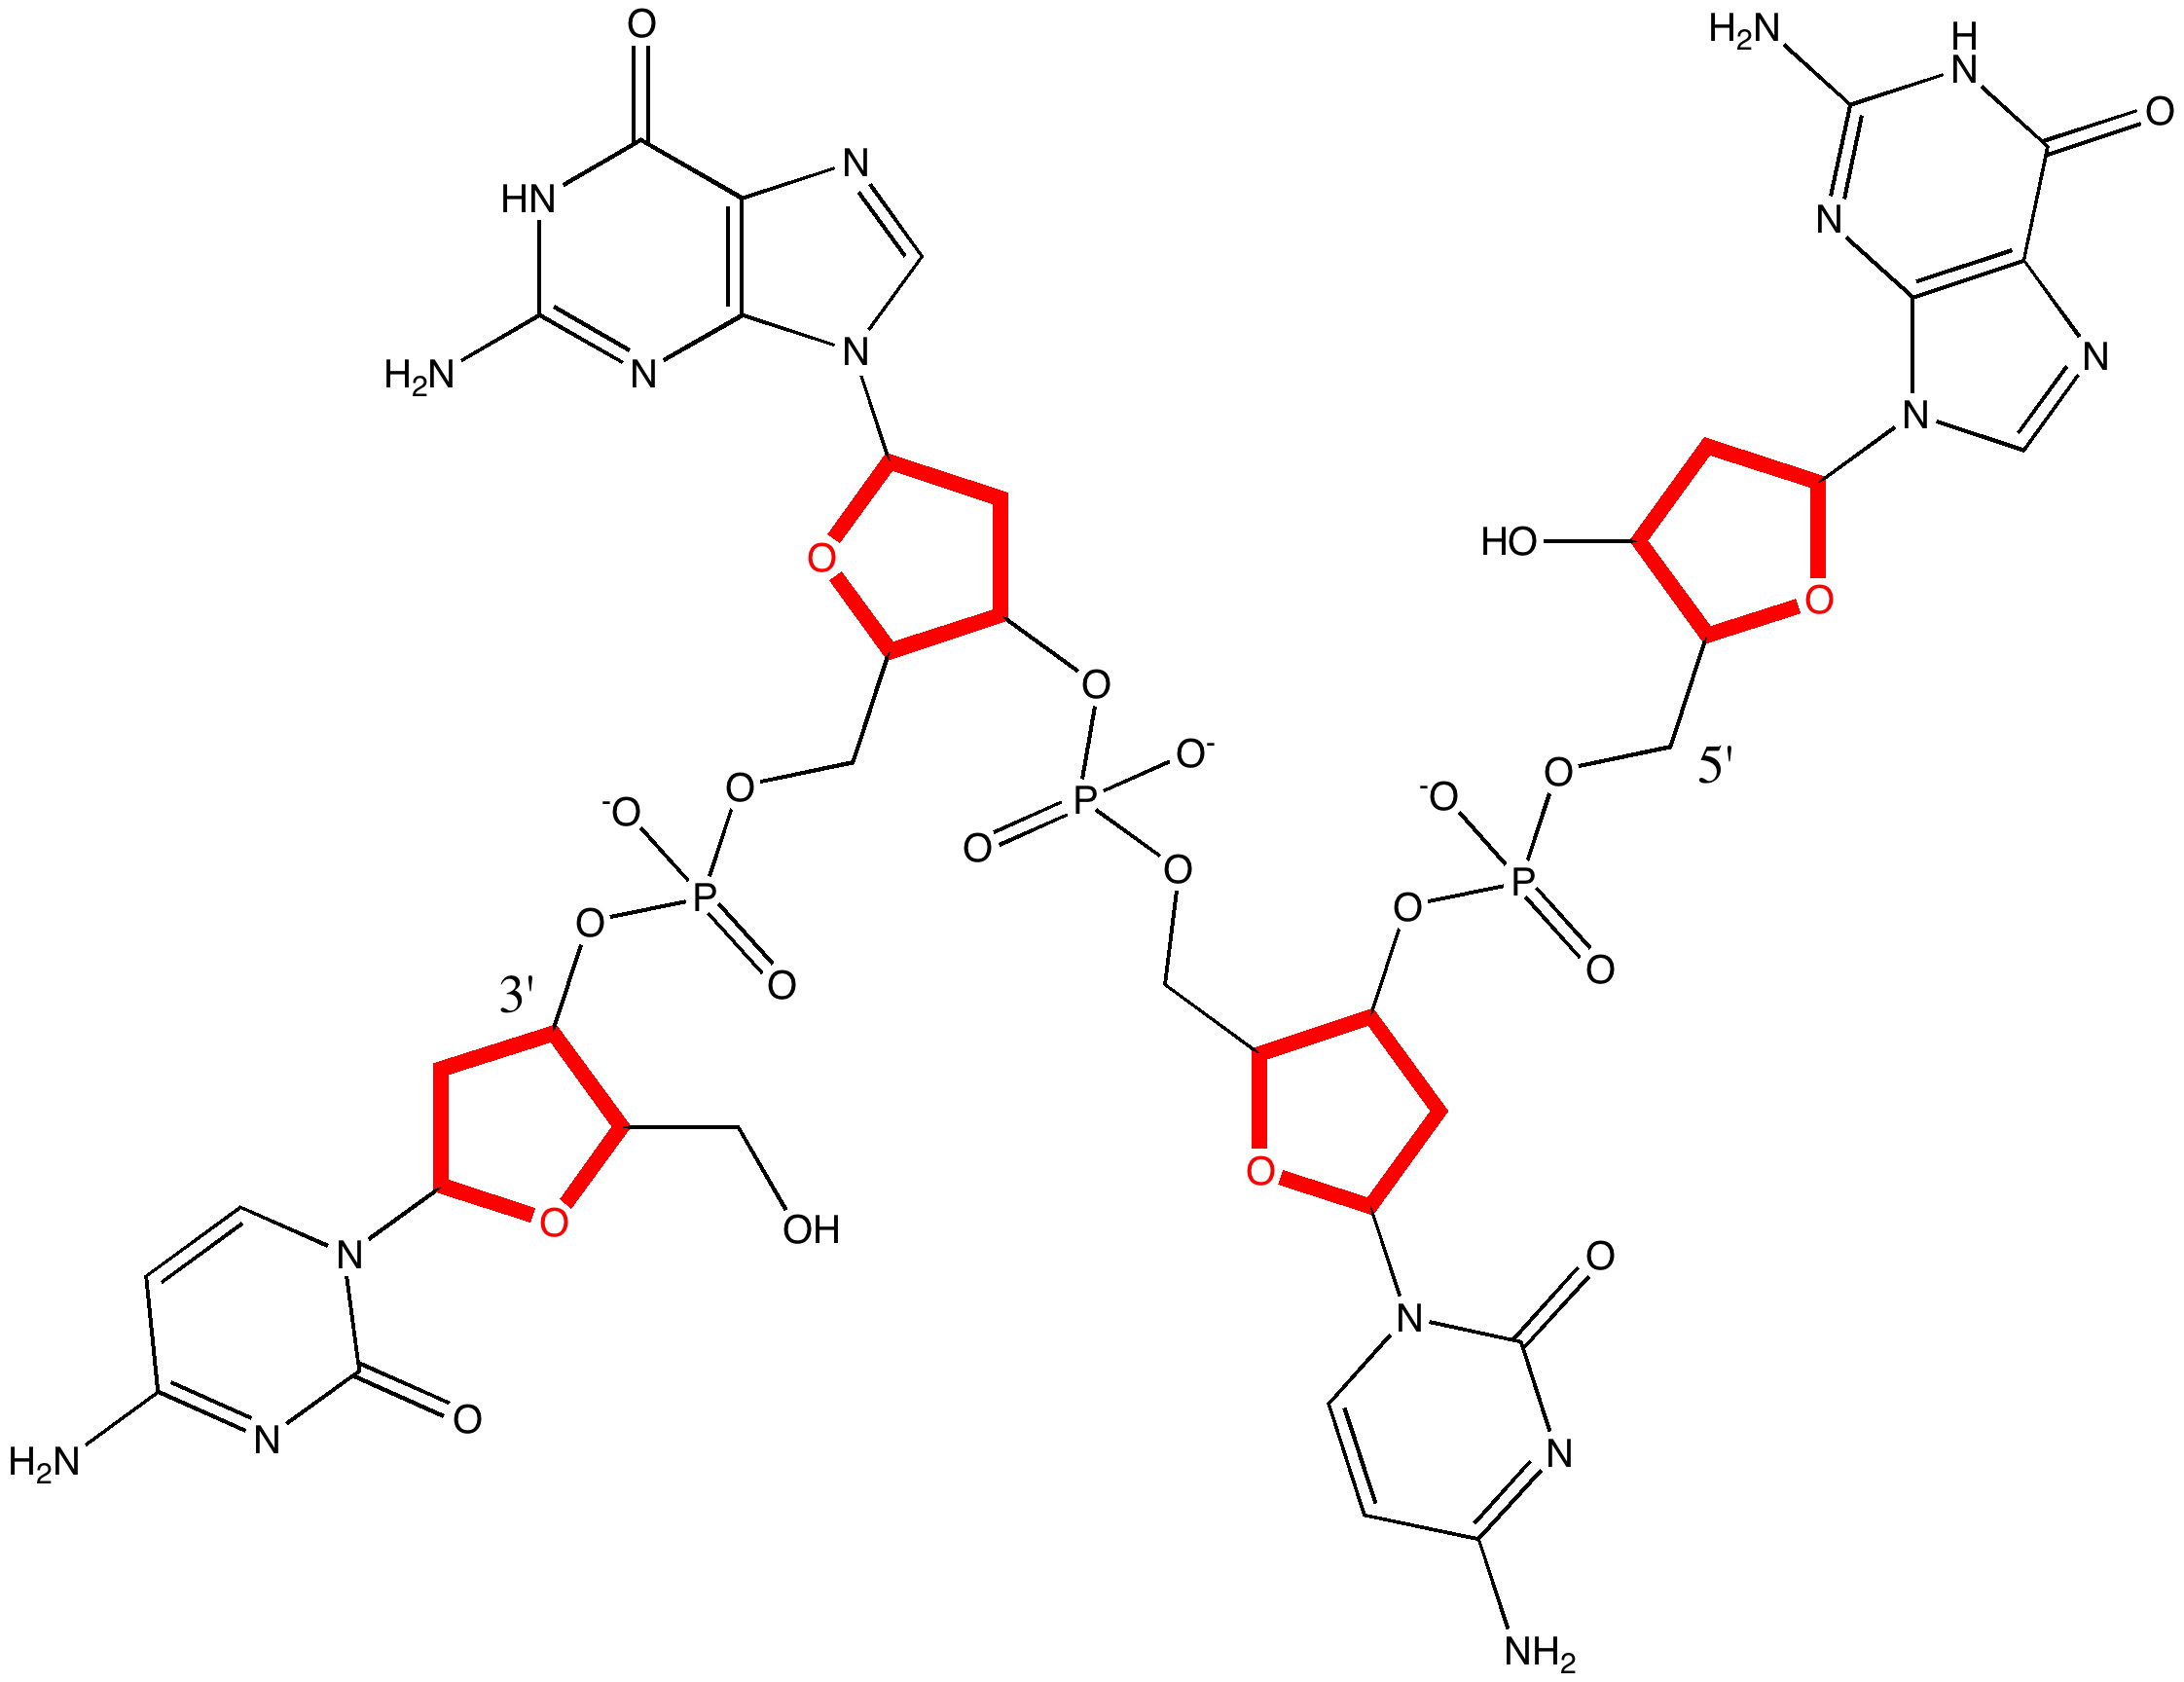
When Watson and Crick (WC) constructed their famous 3D model for DNA, they had to decide whether to make the double helix left or right handed.