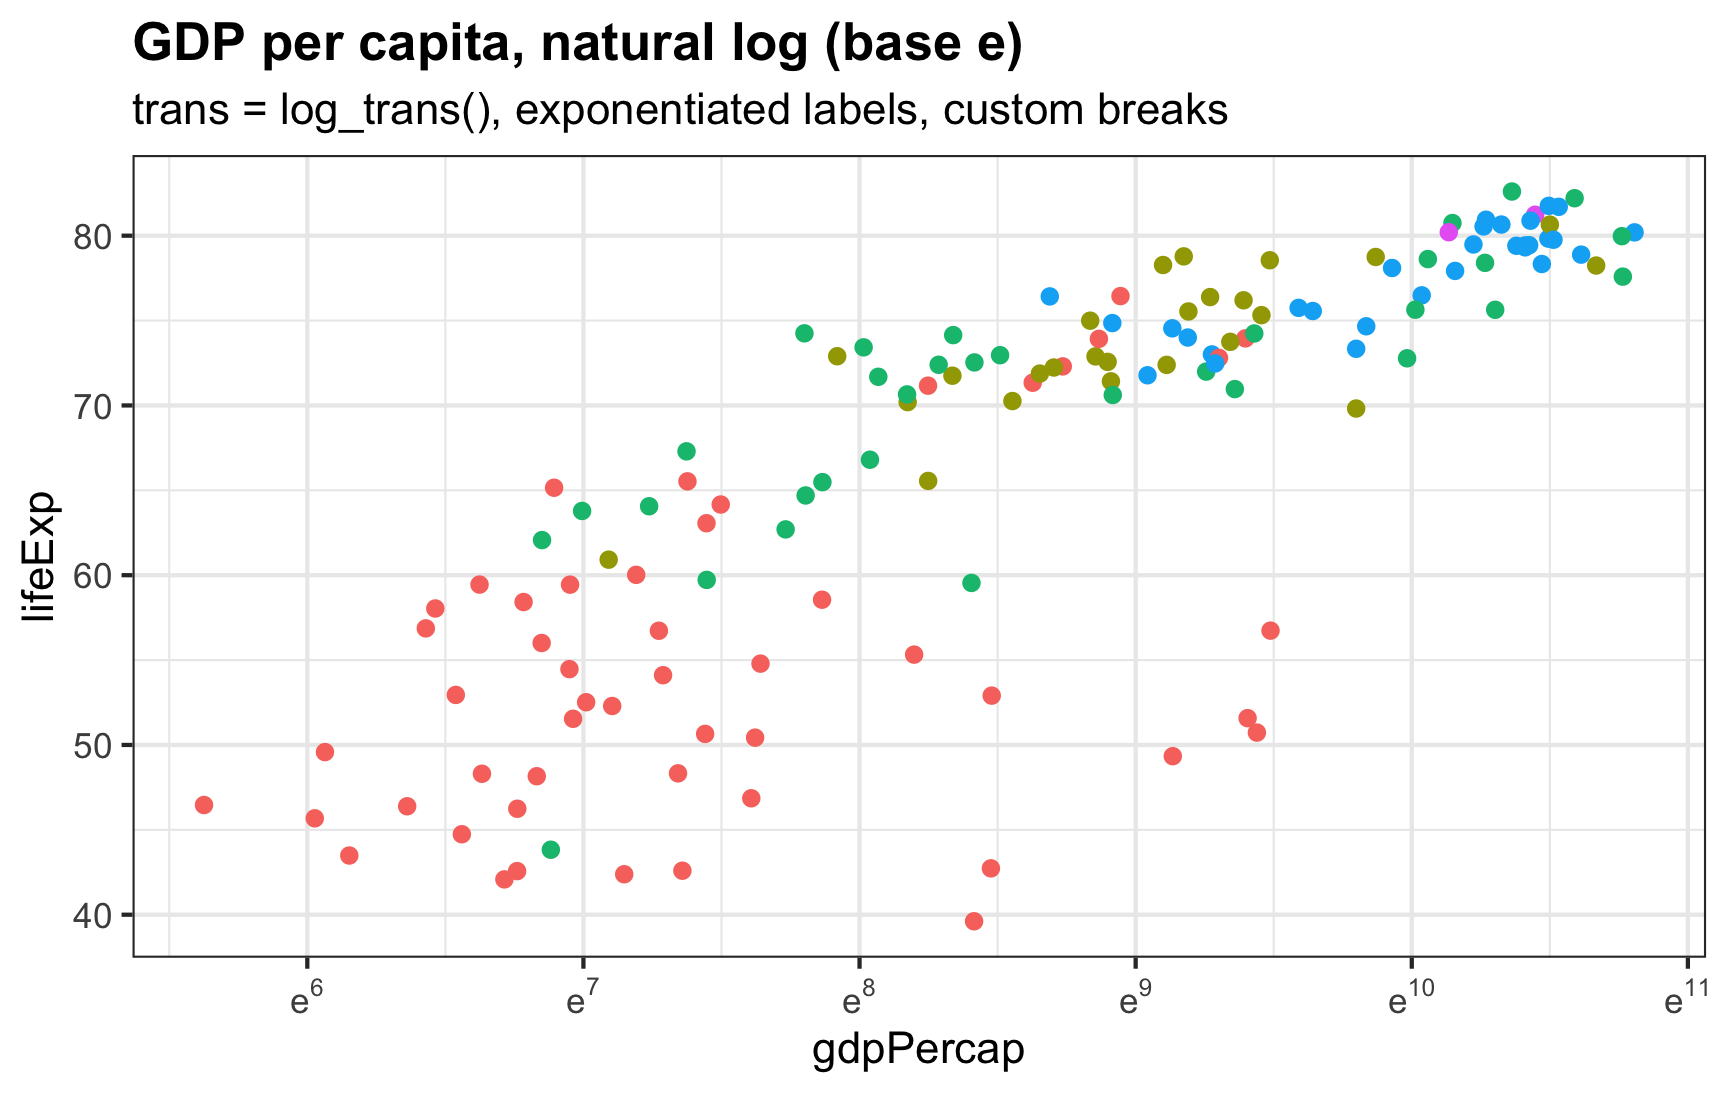
I always forget how to deal with logged values in ggplot—particularly things that use the natural log.

I always forget how to deal with logged values in ggplot—particularly things that use the natural log.

By 30th September 2022, I had clocked up a total of over 2000 km of running in 2022. This milestone was a good opportunity to look at how I got to this point. The code is shown below. First, we can make a histogram to look at the distance of runs. From this type of plot it’s clear that my runs this year consist of a lot of 4-5 km runs and then a chunk of 21 km plus.
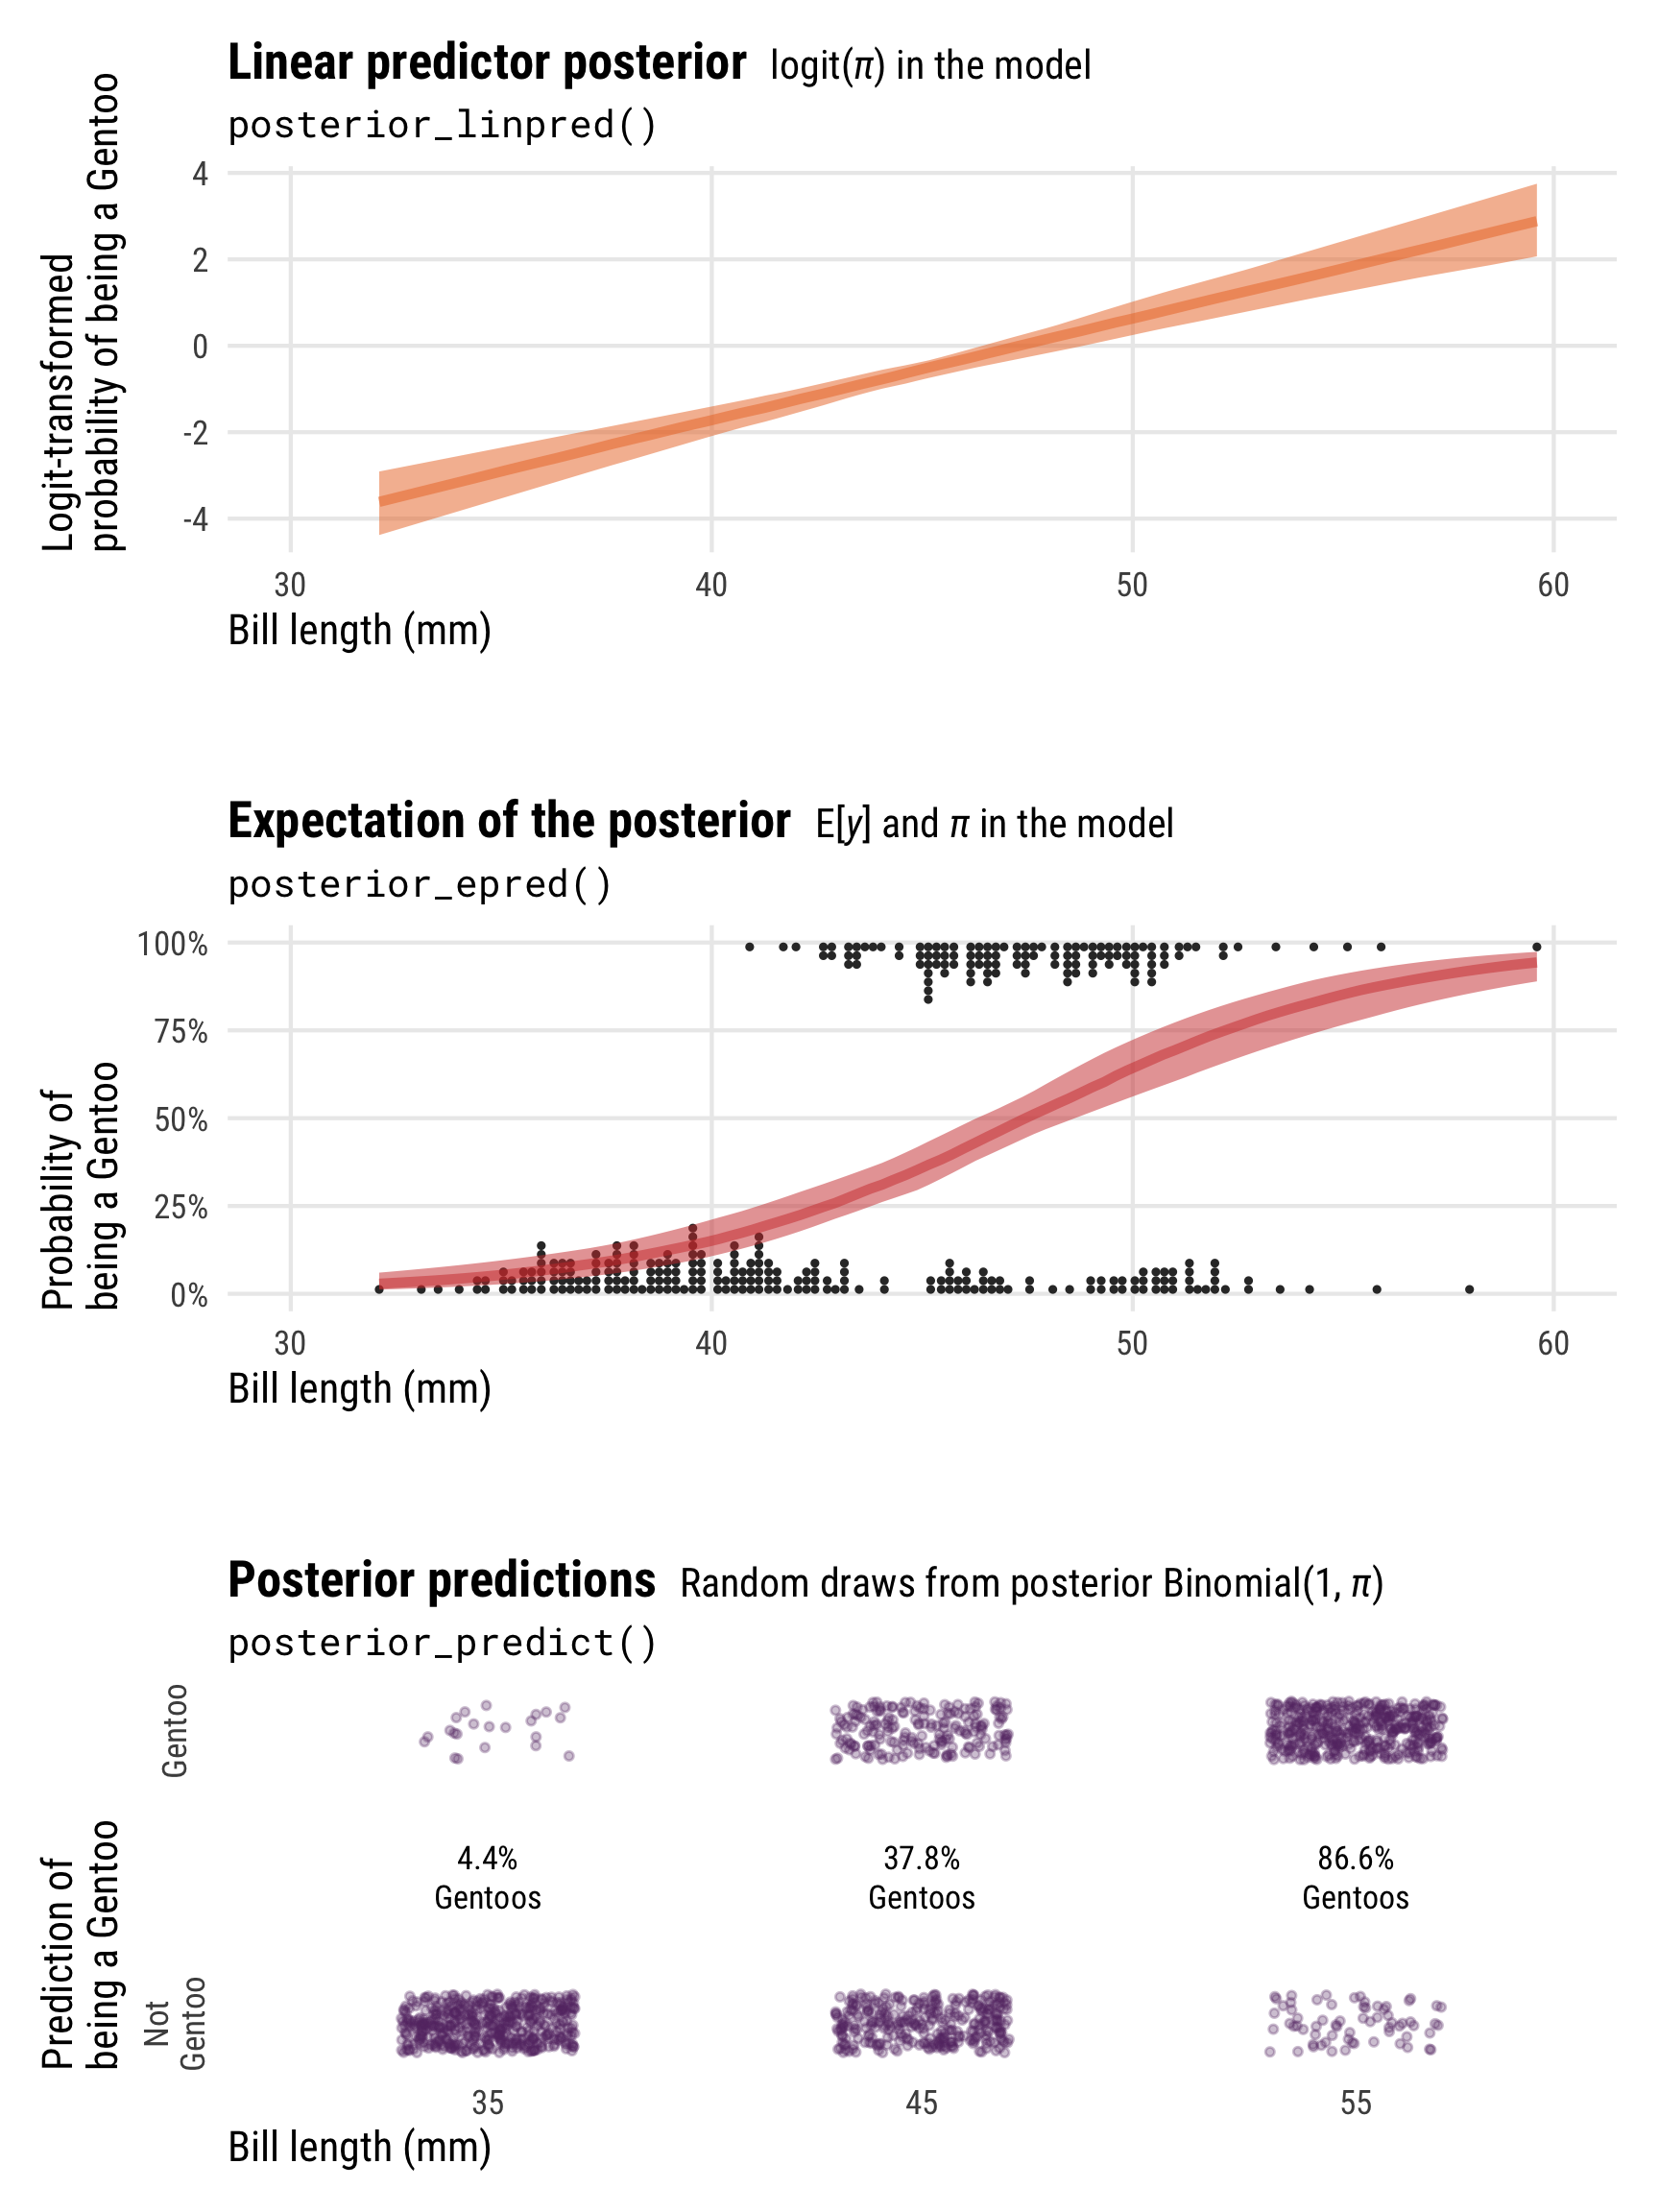
Downloadable cheat sheets! You can download PDF, SVG, and PNG versions of the diagrams and cheat sheets in this post, as well as the original Adobe Illustrator and InDesign files, at the bottom of this post Do whatever you want with them!

It’s been a while since I posted a breakdown of half marathon times. The last time seems to have been 2018. I decided to give my old code a clean-up and quickly crunched the numbers from the 2022 Kenilworth Half Marathon. First, the results: Briefly, the code below reads in a csv file of race results downloaded from the provider.
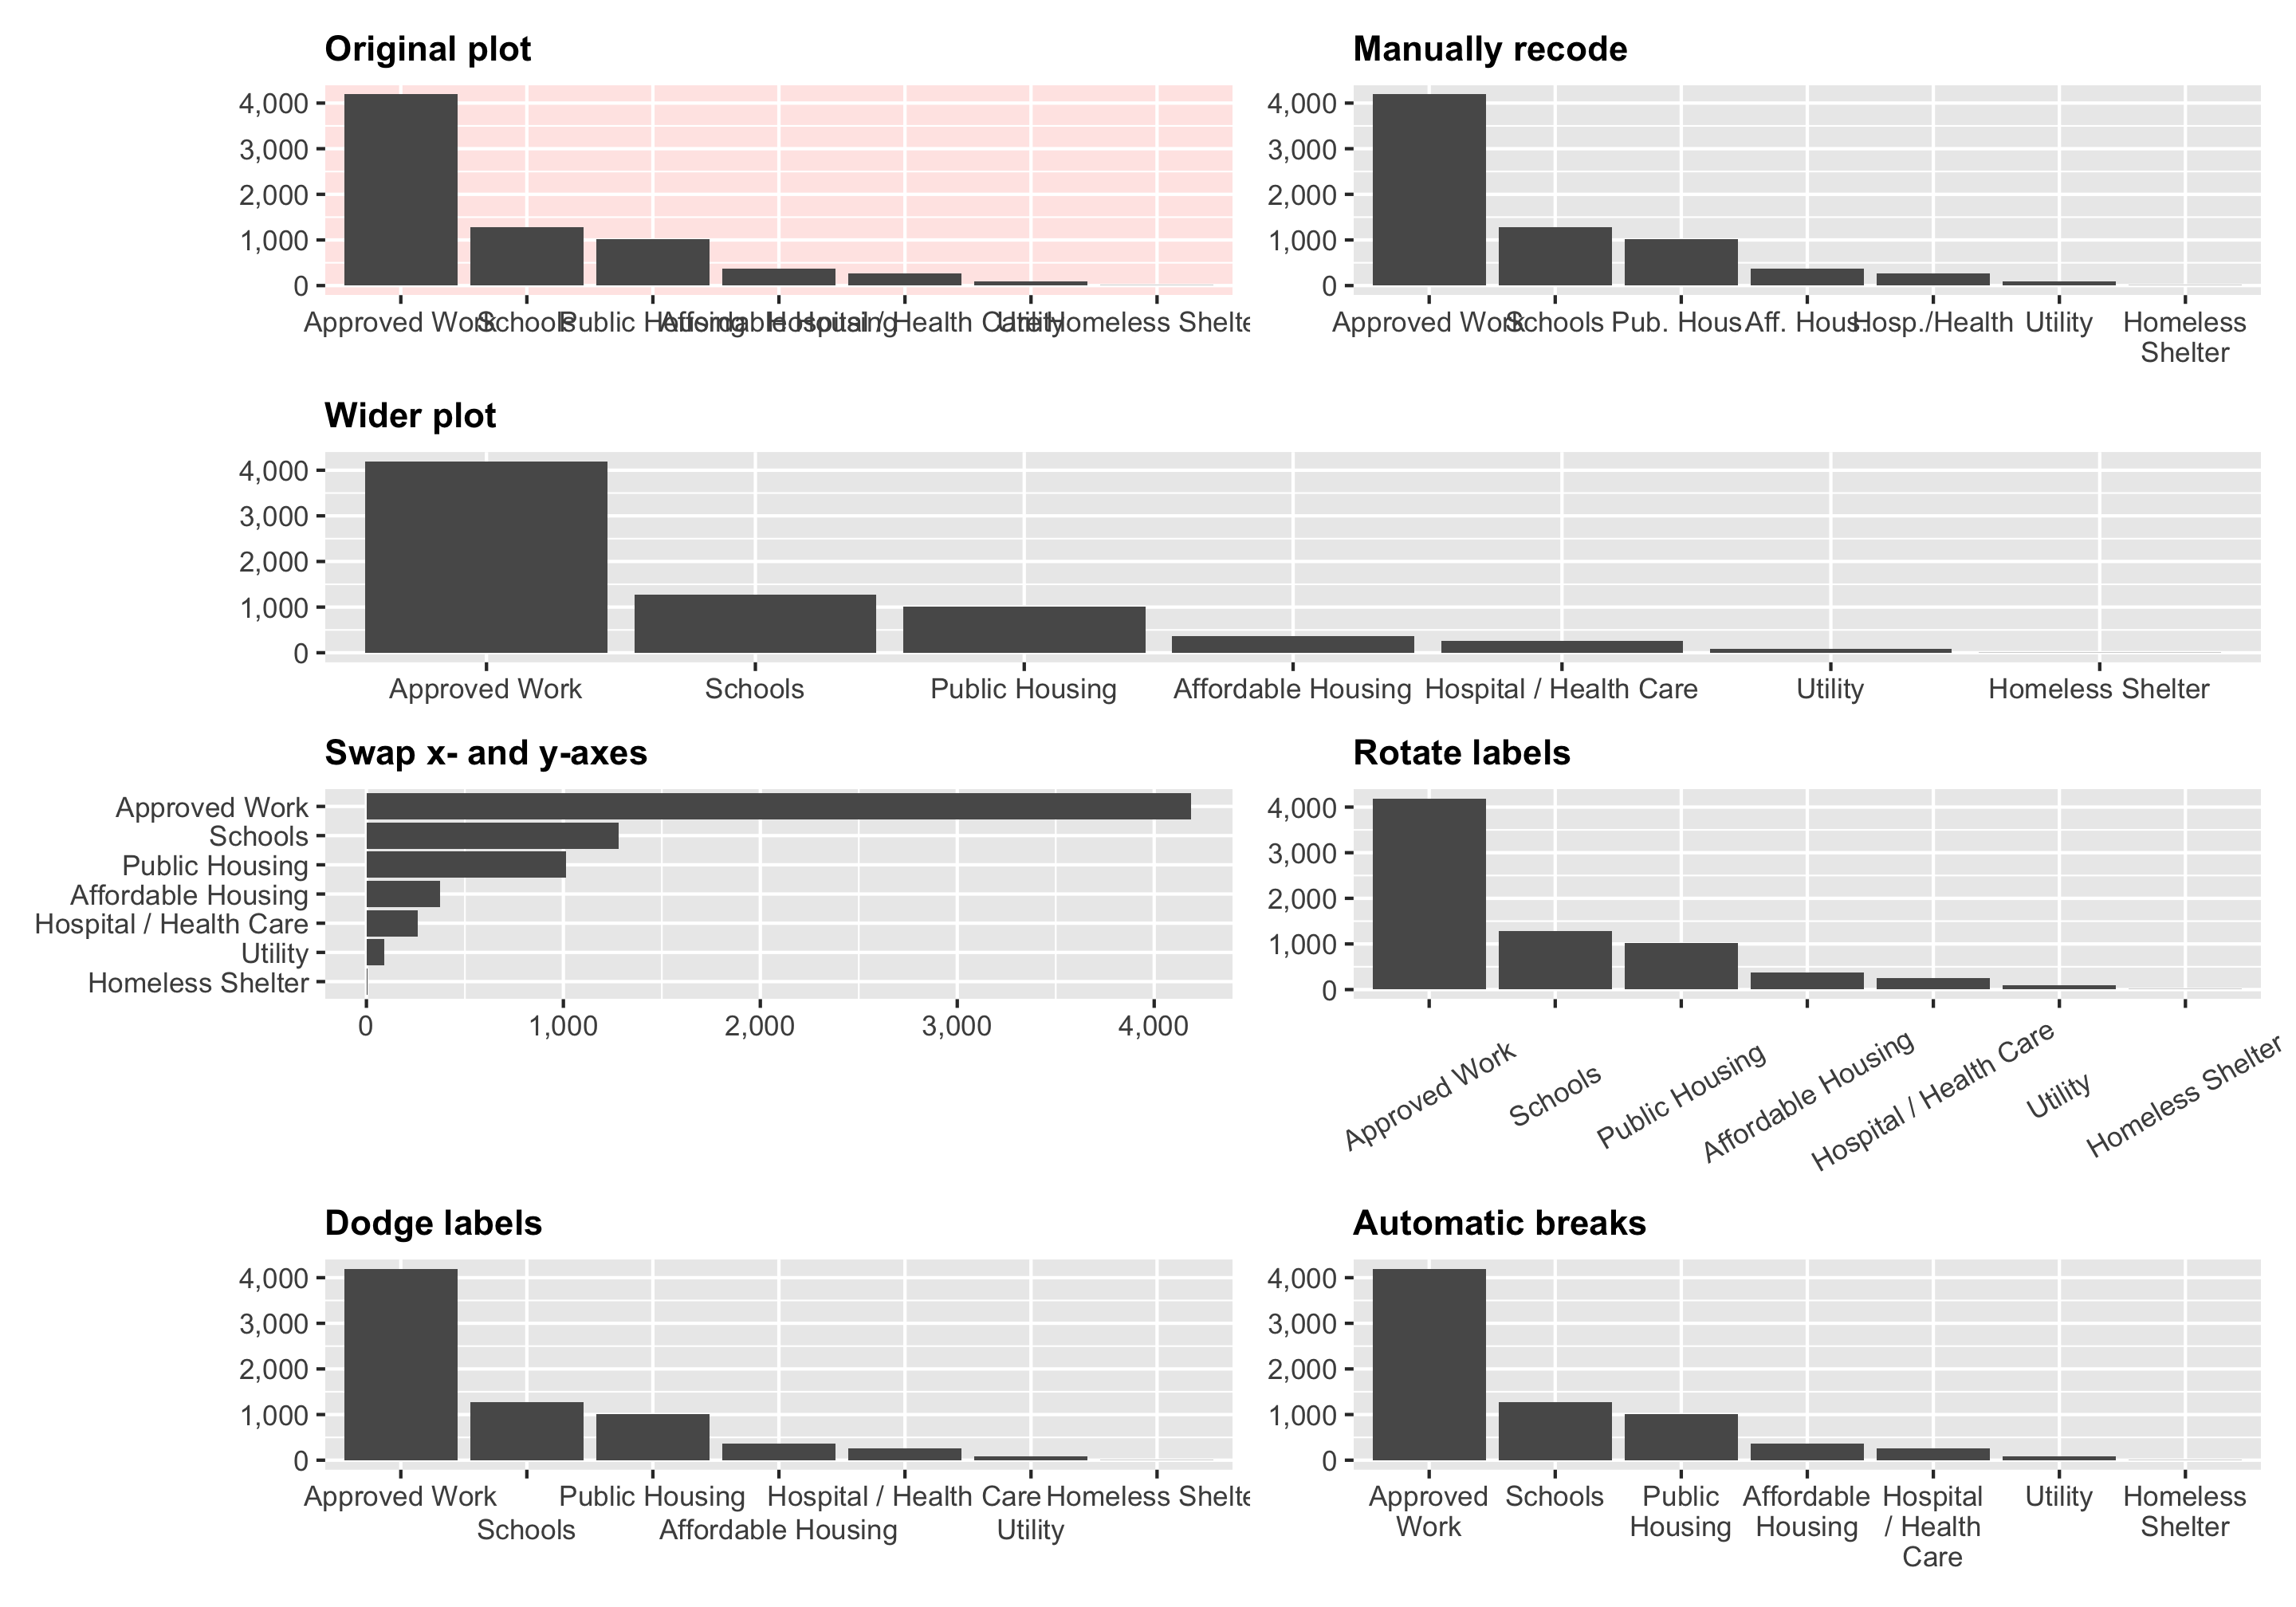
In one of the assignments for my data visualization class, I have students visualize the number of essential construction projects that were allowed to continue during New York City’s initial COVID shelter-in-place order in March and April 2020. It’s a good dataset to practice visualizing amounts and proportions and to practice with dplyr ’s group_by() and summarize() and shows some interesting trends.

The scientific response to the COVID-19 pandemic has been astounding. Aside from efforts to generate vaccines, the genomic surveillance of the virus has been truly remarkable. For example, the nextstrain project has sequence many SARS-CoV-2 genomes. In fact, the rapid identification of multiple new strains and mutations by diverse groups of scientists has resulted in a nomenclature crisis.

Here are 10 tips for making charts that pop.

During the pandemic, many virtual seminar programmes have popped up. One series, “Motors in Quarantine”, has been very successful. It’s organised by my colleagues Anne Straube, Alex Zwetsloot and Huong Vu. Anne wanted to know if attendees of the seminar series were a fair representation of the field. We know the geographical location of the seminar attendees, but the challenge was to find a way to examine research activity at a country level.
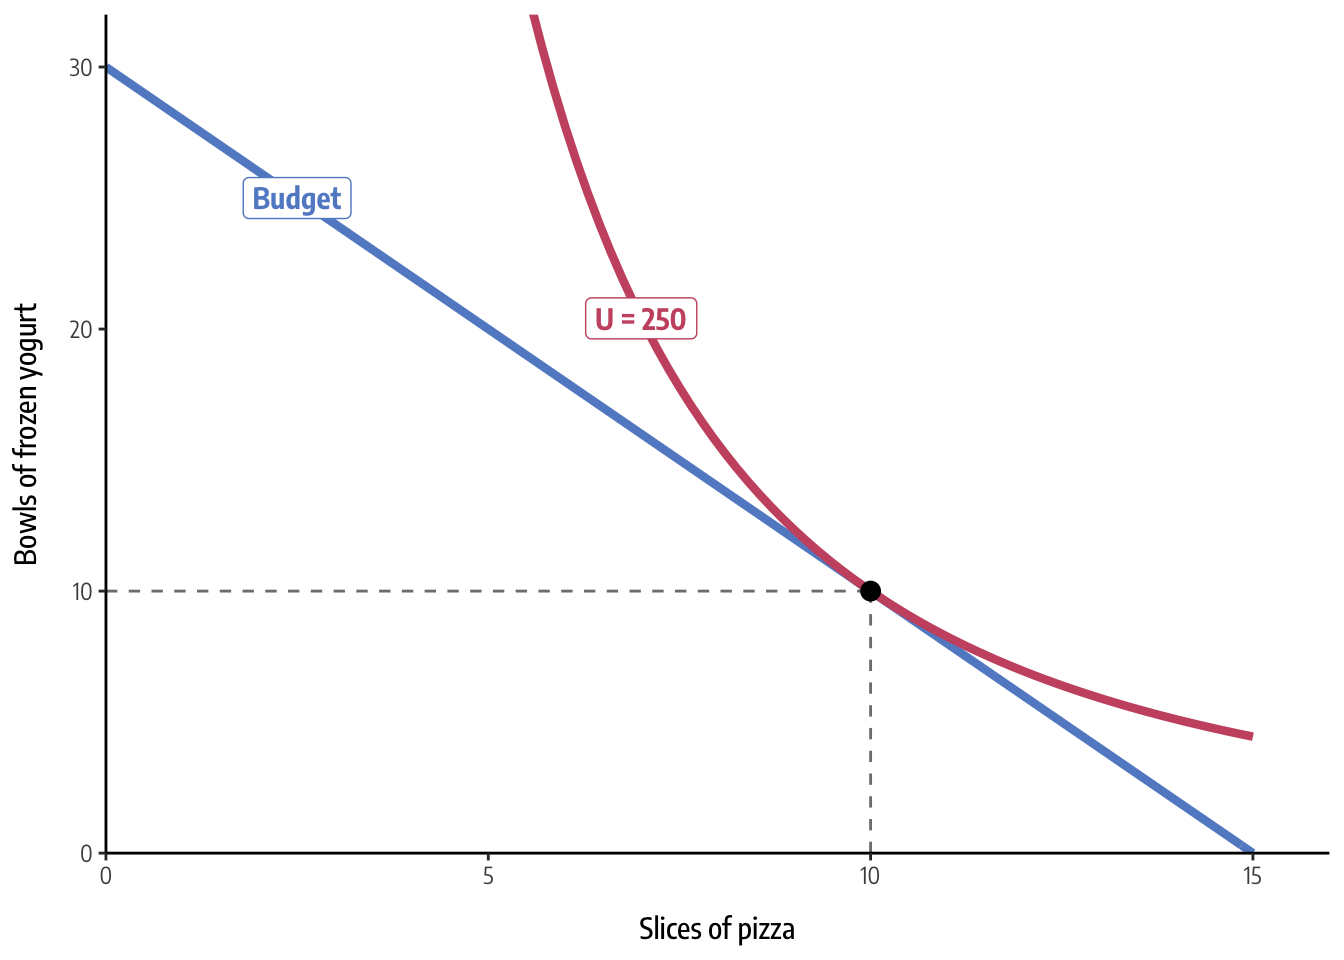
(See this notebook on GitHub) A year ago, I wrote about how to use R to solve a typical microeconomics problem: finding the optimal price and quantity of some product given its demand and cost. Doing this involves setting the first derivatives of two functions equal to each other and using algebra to find where they cross.
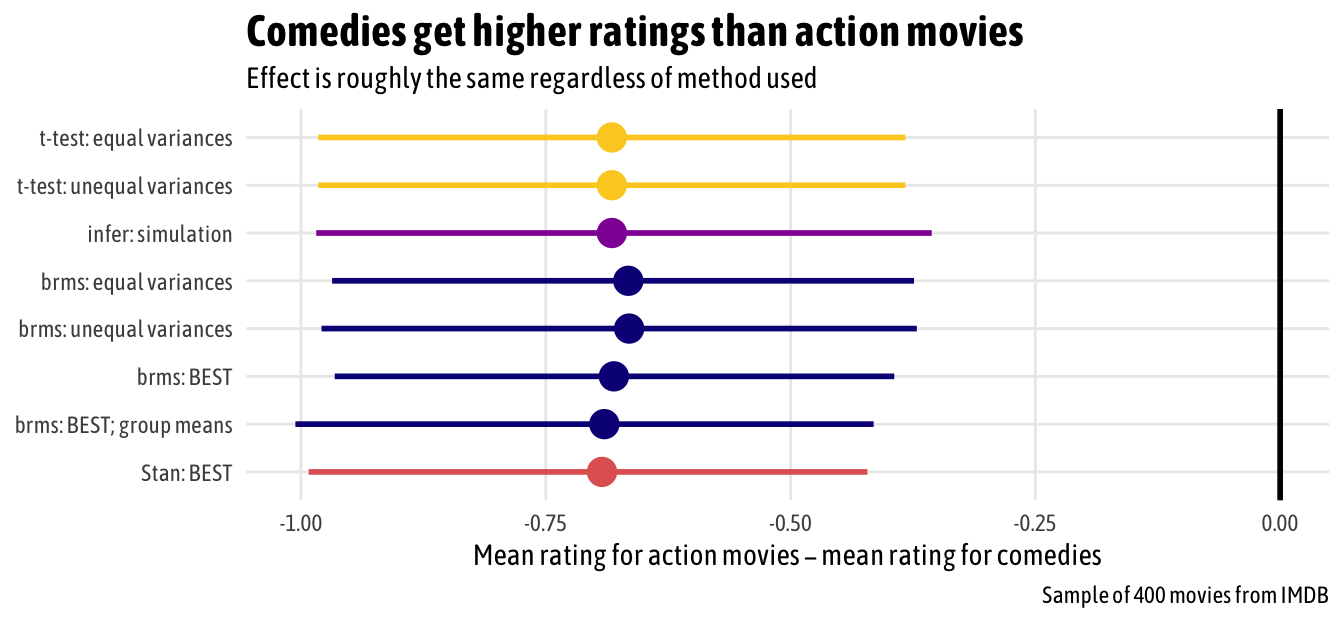
(See this notebook on GitHub) Taking a sample from two groups from a population and seeing if there’s a significant or substantial difference between them is a standard task in statistics.