
6 tools for easy data cleaning, modelling and statistical analysis - Rapidminer, Orange, Rattle, Trifacta, Talend, JASP


It's 2018 and perhaps you are looking for interesting new tools to add to your repertoire. Here are some interesting ones relating to cleaning, analysis and modelling of data that I have encountered in the last year.
JASP - Open Source statistical software similar to SPSS with support of COS
Rattle - GUI for user friendly machine learning with R
RapidMiner - Another point and click machine learning package
Orange - Open Source GUI for user friendly machine learning with Python
Talend data preparation - Data cleaning, preparation tool with smarts
Trifacta Wranger - Data cleaning, preparation tool with match by example feature
They are all open source, or have free versions focusing on cleaning , analysing and modelling data.
JASP - Open Source Statistical software similar to SPSS
R is a very powerful statistical programming language designed for data analysis, but understandably some people prefer a point and click interface. What if I told you there is a free open-source package that is comparable to SPSS in interface but running R in the background?
What I described is JASP .
Running R in the background (see R packages included here), it is designed to cover some of the most common statistical functionality you would need to do basic statistical analysis (e.g. T-tests, ANOVA, various regressions) that you see in most LIS literature as well as more advaned things like meta-analysis, SEM, network analysis (compare this with Gephi) etc, all wrapped up in a user friendly interface.
Here's the current functionality of JASP 0.8.5
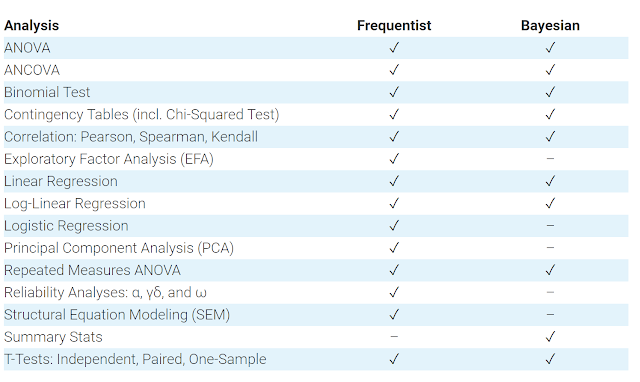
JASP 0.8.5 features
I last used SPSS almost 10 years ago, but I believe JASP's interface is very similar to SPSS, it's simple point and click , drag and drop. From what I have read JASP has a slight advantage over SPSS in that it is child's play in JASP to generate effect sizes as it is just a checkbox away.
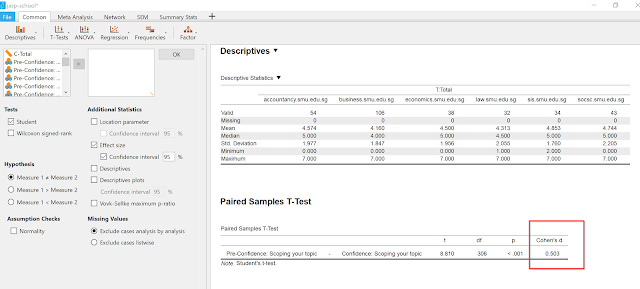
Example of a paired sample T-test with effect size (Cohen's d)
Running a paired sample T-test to compare pre-test scores with post-test scores after a information literacy session or perhaps doing a T-test to measure the different citation counts of open access articles and paywalled articles?
JASP generates them quickly and easily for you in APA-formatted tables that you can easily copy and paste into Word.
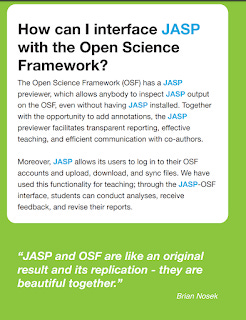
So who are the people behind JASP? The team is funded by a "ERC grant from the European Union, a Vici grant from the Netherlands Organisation for Scientific Research, and permanent support from the University of Amsterdam."
Other sponsors include Center for Open Science (COS), which explains the support for OSF (Open Science Framework).
In short JASP is a very promising open source statistical software, which I'm still exploring. It's already much better than GNU PSPP in my opinion . I'm not a statistician, so I can't tell if it can completely replace SPSS but it does seem to have most of the usual things I tend to use.
Besides the Youtube channel, googling around, I find exercises and tutorials created by statistical professors who are starting to teach the use of JASP in their classes, so it seems use of JASP is starting to emerge as the tool of choice.
Installation was smooth using the zipped pre-installed file package, but I ran into a problem where the antivirus I had on my work-machine, kept complaining about JASP when I ran some t-tests. I'm still trying to figure that out, but one possibility was that that I should have installed JASP directly rather than using the zipped file.
Rattle - GUI for user friendly machine learning with R
In my last post of 2017, I talked about playing with machine learning to get a feel of things.
I'm no data scientist obviously but here are somethings I did to get a feel.
Install R and R studio and learn how to run R commands
Read up on basic concepts of machine learning e.g. supervised vs non-supervised, how to evaluate the results of machine learning (some bits are very similar to what librarians learn about evaluating relevancy of results)
Read up and get a rough sense of various machine learning algorithms such as svm, regression, decision tree, random forest, neural nets, k-means clustering and how to interprete the results in R
Play with worked examples from Kaggle
Most of the concepts of machine learning was pretty straight forward , the algorithms could be tough if you wanted to know exactly how the maths behind each of them worked but in general you just need to know roughly how it works and definitely you do need to know how to interpret the results.
I also ended up working through Machine learning with R book (see below).
It was quite slow going because prior to this, I did not code at all. A lot of machine learning involved installing the right R libraries for each machine learning algo, transforming the dataset into shape for modelling and then running the machine learning algo with the right syntax (different for each machine learning packages) and running an evaluation.
Each step required you to remember the syntax and type it out and a single typo and it wouldn't work. I made progress through 70% of the book but it was painful.
What if there was a software that did all this, but in a GUI with point and clicks? With a few clicks, you could run descriptive summary statistics. Assuming supervised learning , with a few clicks define which variable is the variable to be predicted and how much of the dataset to be paritioned into training and testing (and even for cross-validation). Then with one more click run the same training dataset over multiple machine learning algothrism and evaluate the accuracy of the models produced against the Test test?
If that is what you are looking for Rattle (R Analytic Tool To Learn Easily) meets the bill.
Like JASP, Rattle is a GUI layer over R but designed to import datasets, transform and run machine learning algothrims over them to evaluate the performance of the models produced in a easy manner.
Let me give you a very brief example of what it can do.
Firstly, you should load up the dataset into Rattle using the "data" tab. You can use a R dataset (dataframe) or upload csv.
In the example below, I upload the weather.csv dataset available in Rattle as a test. I have also set the data to be partitioned into 3 parts - Training, test and validation in proportions 70%, 15%, 15%
In Rattle to run any step you need to click on the "execute" button (on top right button) to import the file.
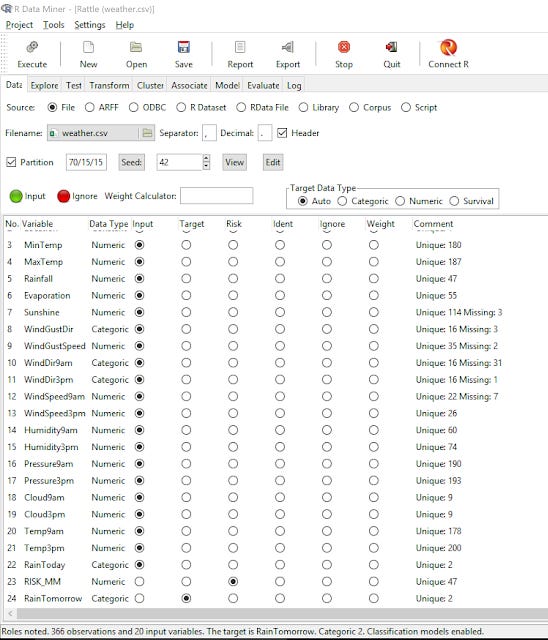
Weather.csv imported into Rattle
Rattle automatically classifies the variable by type "Numeric, Categoric" etc. If you need to change this, you can transform the data-set later in the "Transform" tab.
But most importantly, you will need to ensure the variables are set correctly as "input" or "target".
In this example, say you want to do a supervised learning model to create a model to predict "RainTomorrow". So this has to be set to "target", the rest are "input". Ignore "risk" for now.
On the explore tab, you can run the usual description statistics including correlation matrix generated by R.
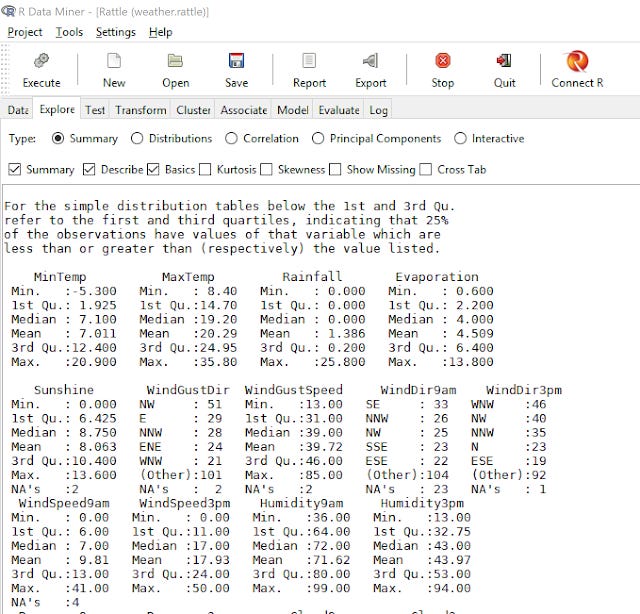
Summary statistics produced in Rattle
If you have done a bit of analysis using R, all this will look very familar to you.
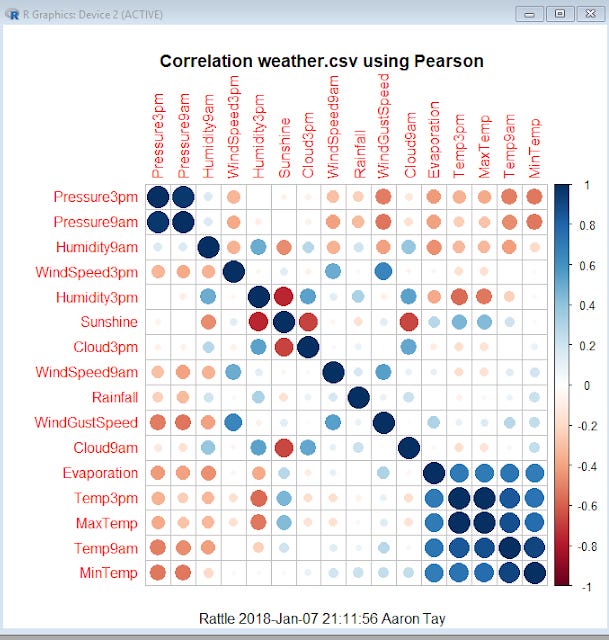
Correlation matrix generated
You can do other tasks like simple transformation of datasets, do clustering analysis of data, but the most useful and the main meat of
Rattle is with the "Model" and "Evaluate" tab.
In the model tab, you can run the following machine learning algos
a) Tree - Decision Tree
b) Forest - Random Forest
c) Boost - Boosting methods
d) SVM - Support Vector model
e) Linear - Linear regression (including logistic, Probit, multinomial)
d) Neural Net
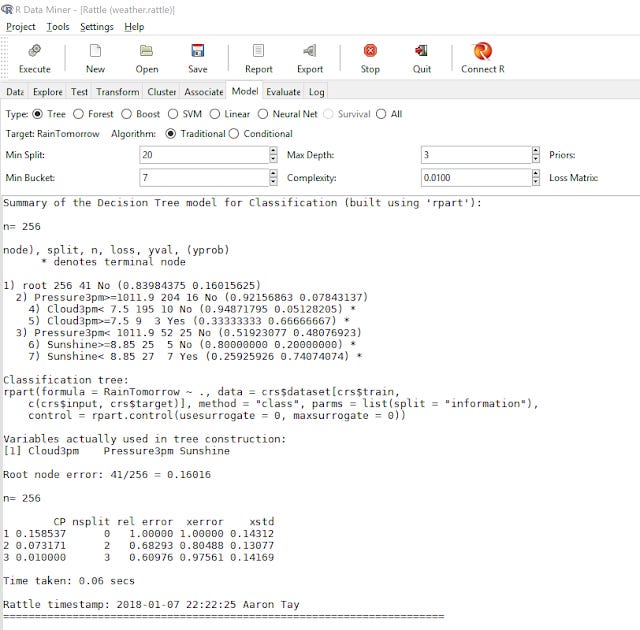
In the above, I have chosen to run Decision Trees, one of the simplest machine learning algos. R outputs the decision Tree rules generated from the training test. This is exactly the same as doing this training in R, except in R you have to type in the commands.
Like in R, you can generate a nice visual of the decision tree generated,
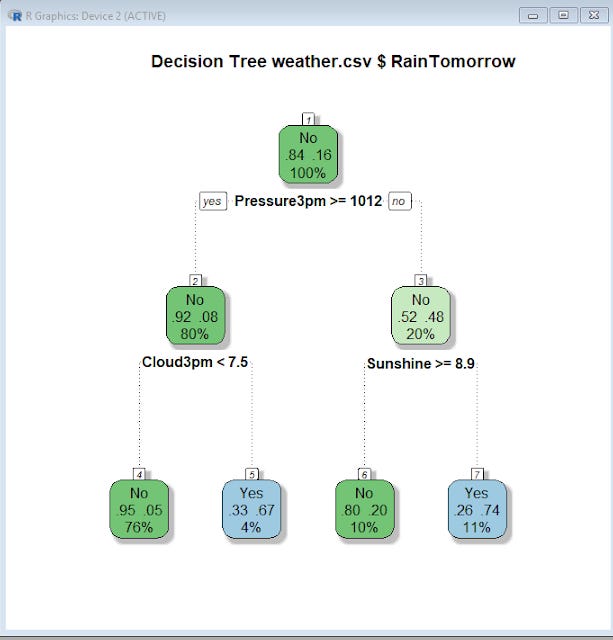
Decision tree generated
So for example, the above decision tree says, if Pressure3pm is less than and equal to 1012 AND Cloud3pm is less than or equal to 7.5, the model predicts it will rain (or raintomorrow = Yes).
But how good is this model you have trained? After all the model created using a dataset will obviously do well against the same dataset because it was created to fit that data after all. This is why you usually retain a test set , a seperate dataset you do no use to the train the model with and see how well the model you just trained handles this "new" data.
This is where you go to the evaluate tab and run the models against test dataset or validation dataset that you have paritioned out of the data earlier.
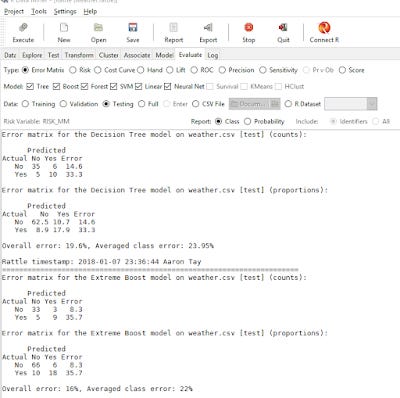
Besides error matrix/confusion matrix you can also generate other measures to compare the performace of each model e.g. ROC curve, Lift, Sensitivity etc.
For a youtube video of this quick demo.
As you click on buttons in Rattle to run the analysis, commands are being sent to the native R interface in the background, and you can actually see the code generated in the logs.
RapidMiner - Another point and click machine learning package
As nice as Rattle is, I've found installing it can be tricky as it is at the core using R. There unfortunately isn't a package you can download and it loads Rattle automatically. Instead you need to download R and then install the Rattle Package using R. This might be a small barrier if you have never used R.
As I installed and ran Rattle functions, it kept popping up warnings and in some cases just gave odd error messages, that was a bit scary.
Some of this relates to the fact that the version of Rattle and the version of R that I was running was a little incompatible (The R base you install could be newer or older than what Rattle works best with), other times it was due to the fact my own R install had incompatible packages and functions that interfered. This is unavoidable due to the nature of R as R packages are written by different people.
Another alternative if you want to move away using R is to use RapidMiner. RapidMiner is developed by a single company and as such you get understandably a smoother and intergrated solution.
RapidMiner is in many ways more capable than Rattle and offers a free version but the big drawback is the free version works on only 10,000 rows but you can increase it to 50,000 if you get someone else to download and install RapidMiner. If you have a email for a educational institution (student or educator), you can apply to get the educational version with no limits.
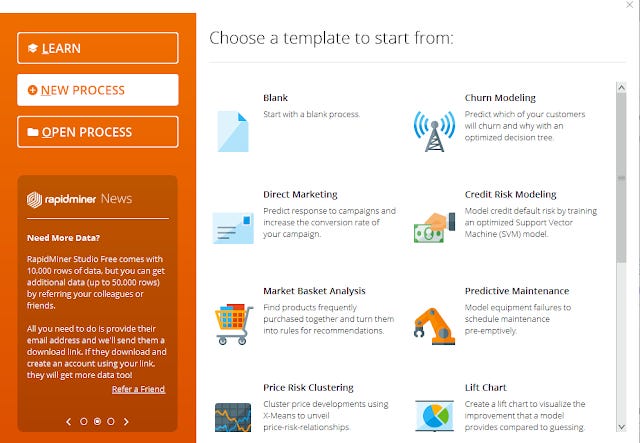
RapidMiner templates
RapidMiner is much more flexible, but is more complicated. You string together different modules and operators to various ports (e.g 'res' port = results. 'tra' port = training, 'mod' port = model, 'exa' port = example) to work on the data, do tranformations, modelling, evaluation before outputting the results.
It can get quite complicated but I appreciate the built in templates that allow you to do common tasks like market basket analysis (in library context could be what databases/journals/articles/books tend to be used toether), Churn analysis etc.
Below shows the same machine learning algo - Decision trees but done in RapidMiner on the survivial of Passengers on the Titanic.
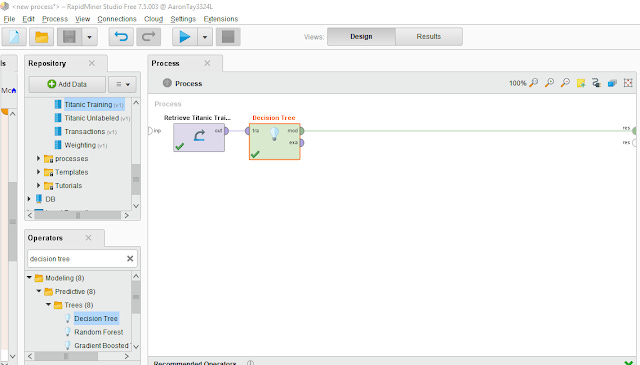
Linking modules in RapidMiner for a basic decision tree
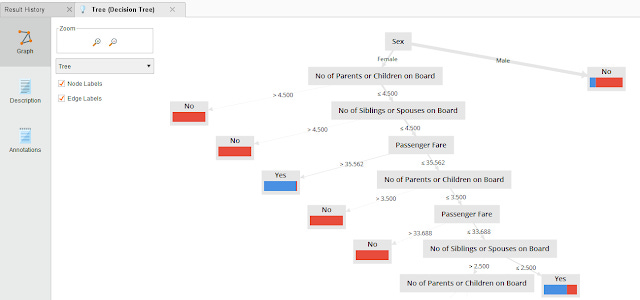
RapidMiner produces a visualization of the decision tree generated
As befits a commerical tool, there are great tutorials and a whole free book - Datamining for the masses that teaches you how to use RapidMiner .
Orange - Open Source GUI for user friendly machine learning with Python
While R is very popular particularly for datascience, arguably if you want to do advanced machine learning Python is where the action is.
So you might be wondering if there is Rattle equalvant for Python. Indeed there is one and it is called Orange.
Installation of Orange is much superior to Rattle has you get a execute package that you can run and it will install everything you need including the python components you need.
I also had a quick play with it, but it looks very similar to RapidMiner , in that you combine different modules (called widgets) to do the tasks you want.
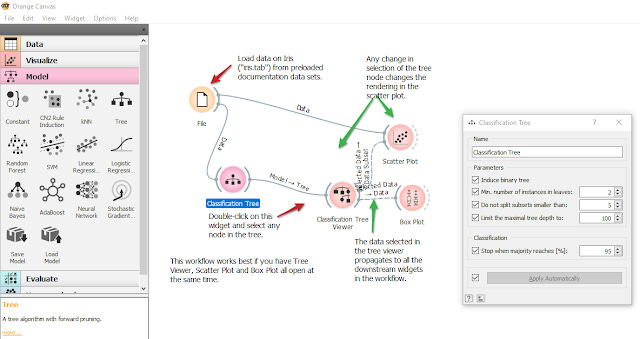
Sample decision tree on Titanic dataset
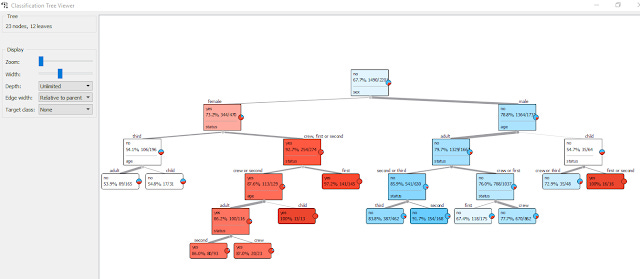
Visualization of decision tree generated in Orange
I haven't tried Orange as much as with Rattle or RapidMiner but it seems more stable than Rattle and is perhaps in between both in terms of complexity of use. I may have to explore this more.
Talend Data Preparation - Data cleaning, preparation tool with smarts
I've blogged and raved about OpenRefine in past blog posts on it's ability to cluster and clean data.
Another tool that looks very similar to OpenRefine is Talend Data preparation.
This is a tool in the class of ETL (extract, transform, load) and like OpenRefine the software uses your browser as the web interface and you can easily run various functions on columns of data to cluster and clean data.
Similar to OpenRefine , all changes made to the data is captured and you can easily undo changes, or save these steps as a "recipe" to reuse on datasets.
The main difference is that Talend Data preparation has built-in smarts that tries to help you.
For example, it will try to auto-detect what data is in a column, so it can guess that a column is a integer field, text field or date field. This isn't particularly unusual but it goes beyond this by auto-detecting other types including but not limited to
First name or Last name
Gender
Email
City
Country
Address_line
US_phone
US_state code
Various countries postal code
Company
and much more
Based on this, it will show at the top of the column, a graphical bar showing the proportion of values that are valid (green), invalid (Orange) or missing (white), this allows you to quickly tell which columns need cleaning up.
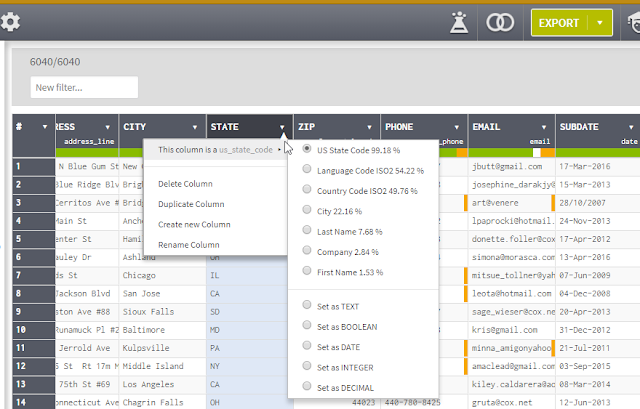
Auto-detects type of data - detects valid, invalid data
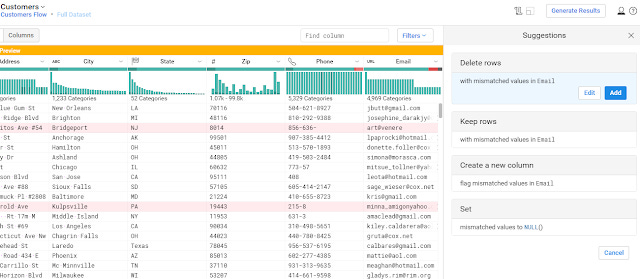
You can then click on the color bars and select to filter automatically to only valid/invalid/empty values or delete them etc.
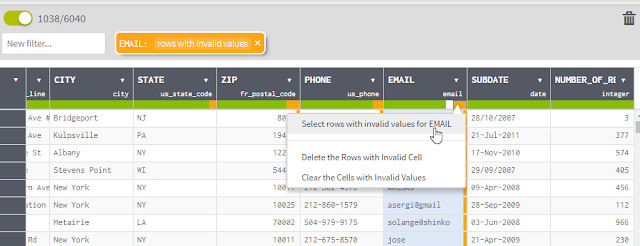
Filter to only invalid values in email column
Talend Data preparation also has some built-in intelligence that helpfully suggests the type of functions you might want to do (probably based on the type of column) and if you can't find the function you can search for it. In this way, it is more user-friendly than OpenRefine where you need to look up the documentation for the right function to use.
Talend Data preparation has other nice profiling features, as you click on columns, in the lower right panel you can see charting of the data in the column, or descriptive statistics (if appropriate etc) . The pattern panel is quite interesting, if you are looking at the date field you can use it to see and fix inconsistent date formats. In the example below, we are looking at a email field so it gives you an idea of what string patterns of email are most popular.
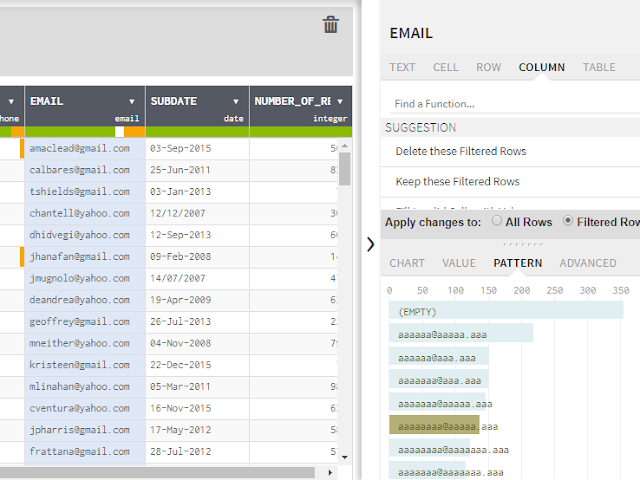
Email strings that are 6 characters followed by a @ and 5 characters followed by a dot and 3 characters are most common.
Overall, Talend Data preparation has a lot of features you don't get in OpenRefine but at the cost of complexity and it feels a touch slower when you click on each column and it profiles the column.
Still the free version has almost no limitations, so it can be a useful tool in your tool-kit to supplement OpenRefine .
Trifacta Wrangler - Data cleaning, preparation tool with match by example field
Trifacta wrangler is very similar to Talend Data preparation, but like OpenRefine feels more lightweight.
Still similar to Talend Data preparation , Trifacta wrangler can automatically recognise various types of data such as emails, addresses, gender, credit cards, Zip codes, IP addresses.
Similarly it profiles the data at the top of each column, showing proportions of valid and invalid data. It displays the distribution of values at the top of each column and not at the right panel though.
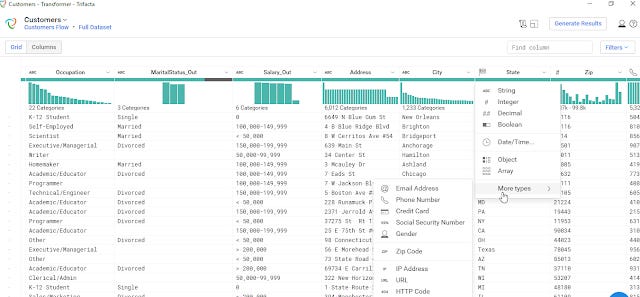
Trifacta Wranger has a similar interface as Talend
Similar to Talend Data preparation, it also intellgently sugguests functions. For example, I select the invalid values in the email fields and it offers options like a) replace those invalid values with null or b) create a new column with a flag for invalid email.
Suggested actions for handling invalid emails
As you mouse over the options , it will show a preview of suggested actions
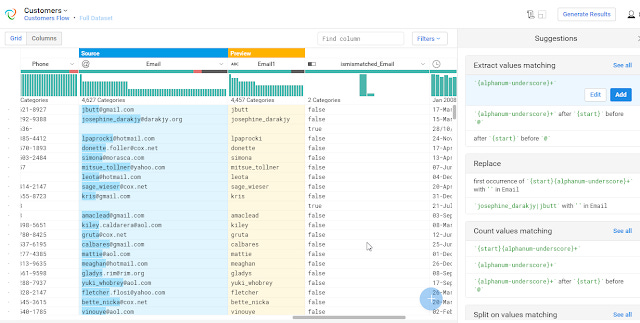
Showing preview of action
One of the smartest things about Trifacta wrangler is how easily you can match and extract strings.
You can of course use regular expressions or use Trifacta's string matching language that is similar to regular expressions but designed to be easier to read. For example you use strings like {alpha} to match alphanumeric characters ( equalvant to [A-Za-z]) and the interface guides you on parameters like number of matches, case sensitivity etc.
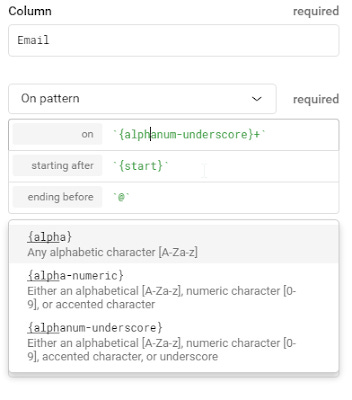
Pattern matching in Trifacta Wrangler
But if all this is too complicated you can try to let Trifacta figure it out by highlighting examples, and as you highlight more examples of what you want to match Trifacta will figure out the required pattern match.
The main disadvantage of Wrangler is that the free version supports only up to 100mb though.
Conclusion
This has been a whirlwind tour of tools that clean, analysis and model data. Which ones listed here are your favourites? Am I missing some obvious new good tools in this area? Do let me know in the comments.
Additional details
Description
It's 2018 and perhaps you are looking for interesting new tools to add to your repertoire.
Identifiers
- UUID
- 4fe54957-7e1f-4dfe-bd56-0c997befa610
- GUID
- 164998368
- URL
- https://aarontay.substack.com/p/6-tools-for-easy-data-cleaning
Dates
- Issued
-
2018-01-09T18:14:00
- Updated
-
2018-01-09T18:14:00