From print /pdf to data - Mathpix, WebPlotDigitzer, Excel app & more tools

In academia, the print paradigm still holds sway. For instance, I've argued that our citation practices makes no sense in our largely digital era.
That said, quite a bit of the content, we read, cite and use are available only in hard copy , or failing that content in PDF that can't be easily manipulated in digital formats.
Here are four light weight tools that I have found recently that might help a little to convert them into digital bits....
1. Converting from print pages to OCRed text
2. Converting tables in Print/PDF to spreadsheets
3. Converting graphs in images to data
4. Converting equations (images) to LaTeX
Converting from print pages to OCRed text
My library was recently considering getting a high quality scanner but when we interviewed students, most of them said they already have a scanner - their mobile phone of course.
In fact for the past couple of years, we have seen apps like Microsoft Office Lens, Google Lens and dozens of other alternatives that allow you to take a picture of some text on a page and the app will OCR the text for you to work on.
But I'm sure most of the savvy readers of my blog already know this. So let's more on to a tougher challenge shall we?
Converting tables to spreadsheet format
Here's a tougher question. You are leafing through a old census report which has a ton of numbers in tables but is available only in hardcopy. How do you convert it to digital format?
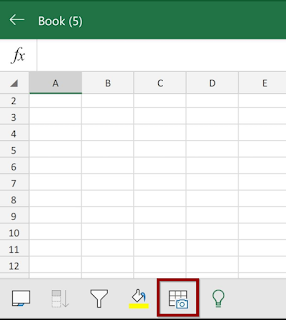
One answer is to use the new Excel mobile app (I believe you need a office 365 subscription which many universities give you acces to), to take a photo image and convert it into excel.
The trick is
1. Open the excel mobile app
2. Click on the icon with a camera

3. Take the photo of the table of data you are trying to capture
4. It will take some time to covert the image to data and will prompt you to review the cells it is not sure of
5. You are done!
What if you have the table of data in PDF? This is easier, various tools can extract the data , one method I read even recommends you open the PDF in Word, convert it to Word and copy and paste.
Another tool that works if you are reading a journal article in PDF format is the tool that I have mentioned quite a bit in the past Scholarcy. Of course it does way more than that.
Converting graphs in images to data
I have been hearing about different publishers go on about the "article of the future" for a couple of years now with the latest versions now been mooted for the sake of reproducability. We see solutions like CodeOcean (which strikes me as like a super version of a Jupyter or R notebook) that allow you to host your data and code that underlies your graph in an article on a seperate platform, so that others can investigate and have a play of data.
Alternatively we see things with a very similar idea but instead intergrates such code and analysis into the article itself.
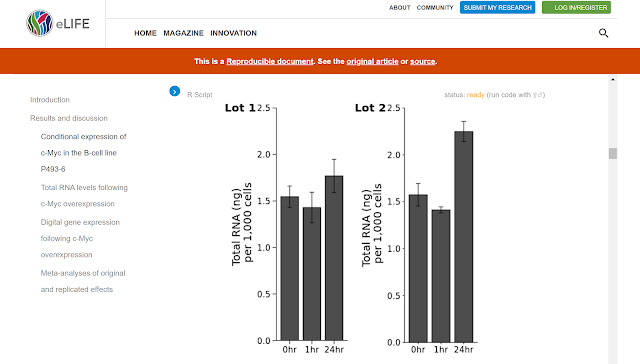
Take for example the recent experiment at elife of the first "computationally reproducible document" that you can find here.
On the surface it looks like a normal article, with seemingly normal graphs. But it's a reproducable graph. What do I mean by that?

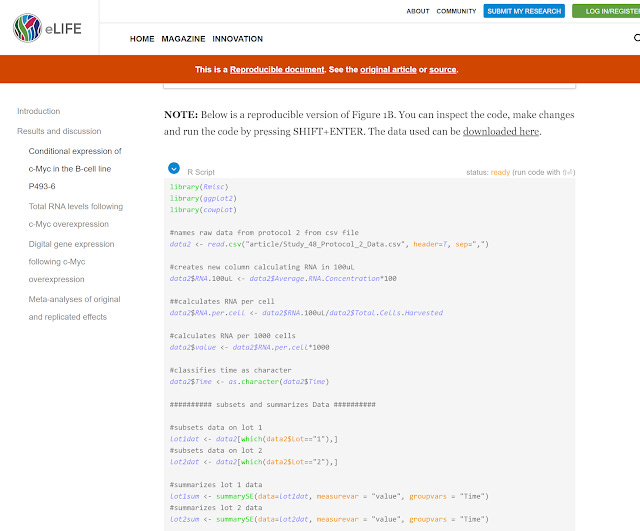
Not only can you download the data behind the graph, but you can see the graph is actually generated by a R script and by clicking on the blue arrow you can see the R script that generated the graph.

You can even change the R code on the fly and regenerate the graph by pressing SHIFT+ENTER.
This seems amazing and I may have a lot more to say about this in the future but for now suffice to say we don't live in such a magical world.
Instead we live in a world of PDFs with static images for graphs. How can we get the data behind the graph?
If you are really lucky there might be a dataset hiding somewhere you can get, or you can contact the author and hopes he replies.
How do you then extract the data points from a static graph? This is where the nifty free WebPlotDigitizer comes into play.
It takes some practice and the tool isn't automated but with some patence in selecting the points in the image requested by the tool (e.g. axis, color of line) the tool can be used to extract data points from various graphs such as XY charts, Bar Charts, Histograms etc
Converting Math equations to LaTeX
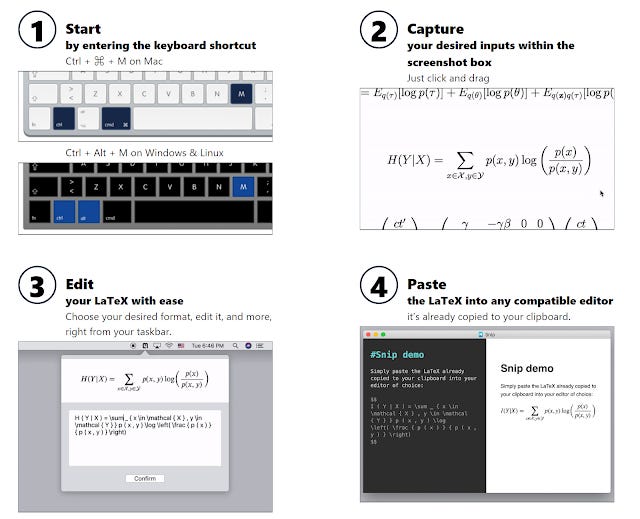
I don't know LaTeX but I understand it can be really difficult to do. So imagine if you could take a screenshot of a math equation and immediately get it in LaTex.
This tool exists and it's called Mathpix

Conclusion
A lot of these tools are meant for light weight use and certainly can't be used if you intend to proccess a lot of pages/data. In particular,there are projects, APIs such as ContentMine that are attempting to liberate data by mining pdfs but are beyond the scope of this post.
Know of any more? Let me know in the comments.
Additional details
Description
In academia, the print paradigm still holds sway. For instance, I've argued that our citation practices makes no sense in our largely digital era. That said, quite a bit of the content, we read, cite and use are available only in hard copy , or failing that content in PDF that can't be easily manipulated in digital formats.
Identifiers
- UUID
- 244808b6-7c8d-4ac4-92cd-ac11ee02c0a9
- GUID
- 164998303
- URL
- https://aarontay.substack.com/p/from-print-pdf-to-data-mathpix
Dates
- Issued
-
2019-05-29T16:09:00
- Updated
-
2019-05-29T16:09:00

