How much work is onboarding?
Creators

Our onboarding process, thatensures that packages contributed by the community undergo atransparent, constructive, non adversarial and open review process,involves a lot of work from many actors: authors, reviewers and editors;but how much work? Managing the effort involved in the peer-reviewprocess is a major part of ensuring its sustainability and quality. Inthis post, we'll take a look at the effort put in by participants in thereview process, and also learn something about exploring GitHub dataalong the way.
🔗Work done by authors
We can try to quantify the development work of authors by looking at thenumber of lines deleted and added in the git repo of the package before,during, and after review. By number of lines we mean number of lines inany file in the repo so it can be lines of actual code and lines of docs(in the README for instance). To do so, we link information from thepackage git repos (information about sizes and dates of commits) andinformation from the onboarding issue threads (start and end dates ofthe review process, as measured by open/close dates).
library("ggplot2")library("magrittr")commits <- readr::read_csv("output/gitsum_reports.csv")issues <- readr::read_csv("data/clean_data.csv")issues <- dplyr::group_by(issues, package) %>% dplyr::summarise(opened = min(created_at), closed = max(closed_at))commits <- dplyr::left_join(commits, issues, by = "package")custom_transf <- function(x){ pof <- log(x) pof[x == 0] <- 0 pof}custom_exp <- function(x){ pof <- exp(x) pof[x < 0] <- - exp(-x) pof}plot_commits <- function(package_name, commits){ message(package_name) example <- dplyr::filter(commits, package == package_name, !is_merge) p <- ggplot(example) + geom_segment(aes(x = datetime, xend = datetime, y = 0, yend = custom_transf(total_insertions)), col = "salmon", size = 1) + geom_segment(aes(x = datetime, xend = datetime, y = 0, yend = - custom_transf(total_deletions)), col = "blue", size = 1) + ylab("lines") + annotate("segment", x = min(example$datetime), xend = max(example$datetime), y = 0, yend = 0, col = "grey50", size = 0.2) + scale_y_continuous(breaks= seq(min(-custom_transf(example$total_deletions)), to = max(custom_transf(example$total_insertions)), by = 5), labels= round(custom_exp(seq(min(-custom_transf(example$total_deletions)), to = max(custom_transf(example$total_insertions)), by = 5))))+ annotate("rect", xmin = example$opened[1], xmax = example$closed[1], ymin = - custom_transf(max(example$total_deletions)), ymax = custom_transf(max(example$total_insertions)), fill = "grey80", alpha = 0.6, col = "grey10", size = 0.2) + ggtitle(package_name) + hrbrthemes::theme_ipsum() print(p)}Let's have a look at a few packages. The x-axis represents time, and thegrey box the onboarding period (from issue opening i.e. submission toissue closing i.e. approval). The salmon lines above the y-axis are thenumber of lines added in one commit while the blue lines below they-axis are the number of lines deleted in one commit.
plot_commits("opencage", commits = commits)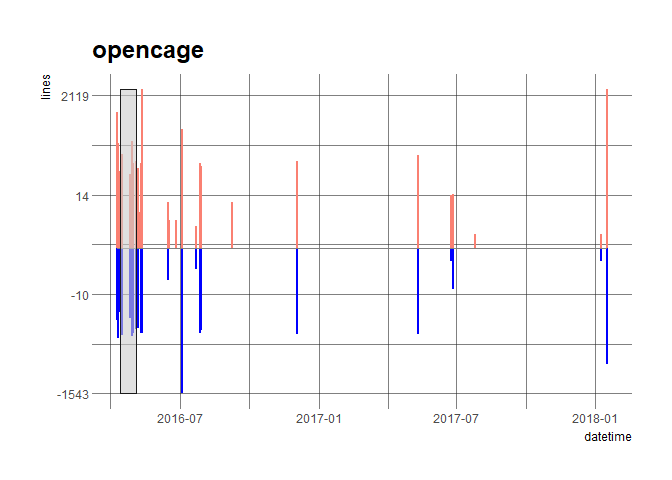
plot_commits("charlatan", commits = commits)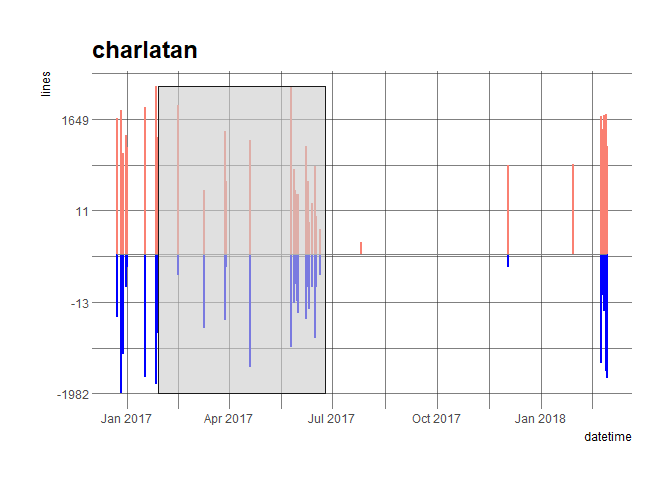
When looking at all onboarded repos, we don't see a general pattern tocommit histories. Commits have diffent sizes, and the activity frequencyis highly variable. While we see the updates to packages that occurduring review, there is just as often change again after onboarding, aspackages continue to improve and be maintained. This highlights animportant aspect of our peer review, which is that acceptance is not theend of the process. While we aim for the process to ensure high qualityat acceptance, packages are not static moving forward. Not alldeficiencies are detected by peer reviewers, and further improvementsand maintenance will continue. This is why many of our standards areabout maintainability, and our process is in part an approach to onboardauthors into a community of dedicated and supportive packagemaintainers.
We do try to onboard mature packages, i.e. that are not drafts.Furthermore, the absence of general patterns in the previous figurescould be due to different age at submission. How old are packages atsubmission?
age <- commits %>% dplyr::group_by(package) %>% dplyr::summarise(age = difftime(min(opened), min(datetime), units = "weeks")) %>% dplyr::filter(age > 0)library(hrbrthemes)ggplot(age) + geom_dotplot(aes(age), binwidth = 5) + xlab("Age (weeks)") + scale_y_continuous(NULL, breaks = NULL) + hrbrthemes::theme_ipsum(base_size = 16, axis_title_size = 16)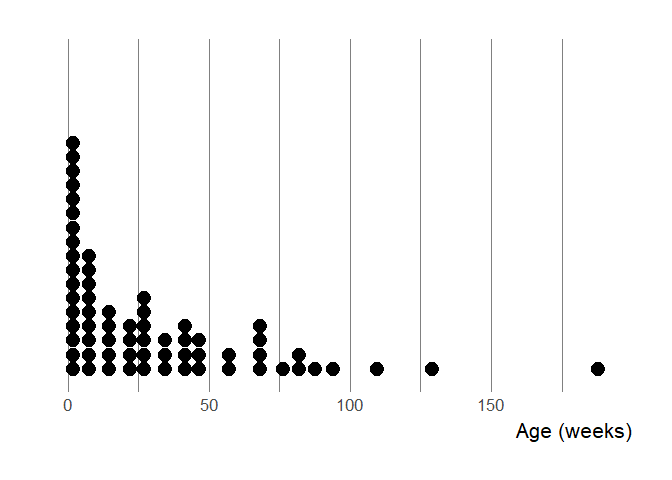
On this dotplot, the x-axis represents age at submission and each dot isa package falling in that age bin. We say apparent age because thefirst commit might happen a long time after the package was created,although often one makes an initial commit not long after having startedto work. We needed to filter positive age because in one case the GitHubrepo of the onboarded package was apparently deleted and re-createdwithout history after approval. Such things happen, thankfully thepackage wasn't lost, just its history!
Many packages are submitted while still very young which might indicaterapid development. It might also mean some authors viewed onboarding asa part of development, i.e. authors knew they intended to submit quiterapidly. For instance, Maëlle developed opencage in just a few days,then submitted it to get it ready for wider use by the community.
🔗Work done by reviewers
How much effort is put in by reviewers in this process? Reviewer timeand effort is one of our most precious resources (you can read moreabout reviewer motivations and perspectives in other blog posts by MaraAverick,VerenaHaunschmid,Charles T. Grayand MilesMcBain). Wemeasure this effort by asking reviewers to self-report the hours spentreviewing. We do so to understand the amount of effort we are askingreviewers for, so we can let new reviewers know what to expect, and sohopefully in the future we can measure the success of efforts toautomate some reviewer tasks.
# airtable data# this is our private database of who's reviewed what# and of reviewers' areas of expertiseairtable <- airtabler::airtable("appZIB8hgtvjoV99D", "Reviews")airtable <- airtable$Reviews$select_all()We have self-reported reviewing times for 136 of 184 reviews.
ggplot(airtable) + geom_boxplot(aes(y = review_hours, x = "")) + hrbrthemes::theme_ipsum(base_size = 16, axis_title_size = 16) + theme(axis.title.x=element_blank()) + ylab("Reviewing time (hours)")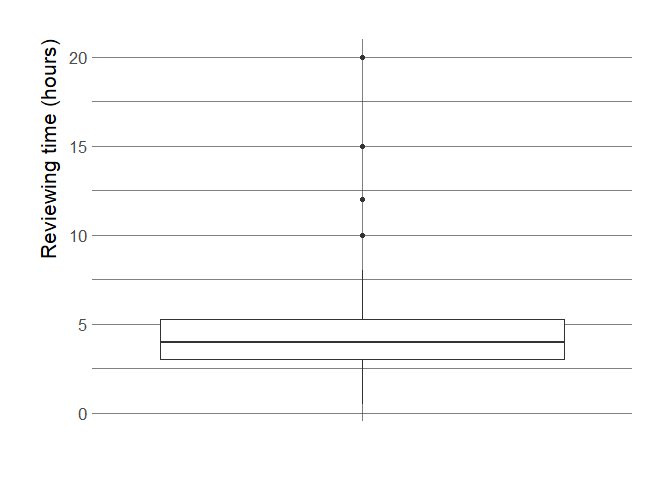
It appears to take our reviewers a similar amount of time to review Rpackages as scientists take to review a manuscript (5 hour median and 9hourmean).
One potential question is whether reviewer time is affected by the sizeof the package reviewed as measured by for instance number of exports(classes and functions).
get_namespace <- function(package_name){ message(package_name) local_path_archive <- paste0(getwd(), "/repos_at_submission/", package_name) if(length(fs::dir_ls(local_path_archive)) != 0){ ns <- devtools::parse_ns_file(local_path_archive) tibble::tibble(package = package_name, exports = length(ns$exports) + length(ns$exportClasses)) }else{ return(NULL) }}packages <- fs::dir_ls("repos_at_submission") packages <- stringr::str_replace_all(packages, "repos_at_submission\\/", "")purrr::map_df(packages, get_namespace) %>% readr::write_csv("output/namespace.csv")Interestingly, we find no relationship between the reviewing time andnumber of exports:
namespace_ro <- readr::read_csv("output/namespace.csv")namespace_ro <- dplyr::left_join(namespace_ro, airtable, by = "package")ggplot(namespace_ro) + geom_point(aes(exports, review_hours)) + hrbrthemes::theme_ipsum(base_size = 16, axis_title_size = 16) + ylab("Reviewing time (hours)") + xlab("No. of exports")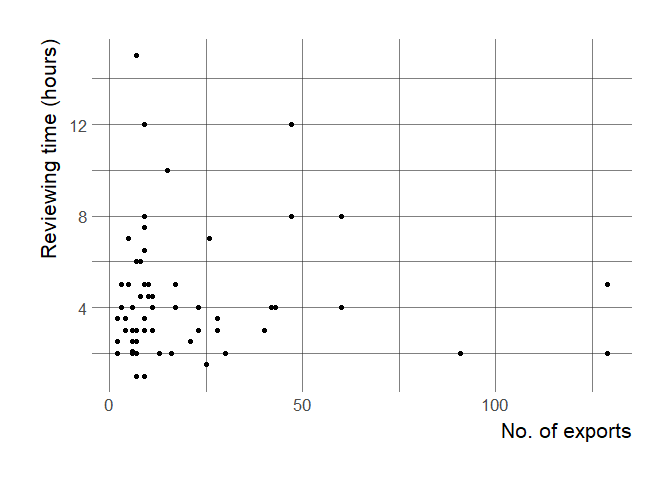
There are a few potential explanations to this that might be fruitful toexplore. For instance, does this mean that there's only so much time,and so larger packages get less scrutiny per line of code or per export?Or does review time just depend more on the reviewer than the package?
🔗Work done by editors
Editors manage the review process, performing initial package checks,identifying and contacting reviewers, and then moderating and cajolingthe process forward. Our best measure for editor effort is the number ofpackages handled by an editor in a given time frame, which we can trackfrom the assignments on GitHub issues since the start of onboarding.Looking at this over time, we can see how editor workloads changed inresponse to growing number of assignments and how we have attempted tomanage this by expanding our editorial board:
library(tidyverse)library(gh)library(lubridate)issues <- gh("/repos/ropensci/software-review/issues?state=all&labels=package", .limit=1000)edits = map_df(issues,~data_frame(url = .$html_url,editor = .$assignee$login %||% NA_character_,opened = as.Date(.$created_at))) %>%filter(!is.na(editor)) %>%mutate(quarter = paste(year(opened), quarter(opened), sep="Q"),half = paste(year(opened), if_else(quarter(opened) <= 2, 1, 2), sep="H"),year = year(opened))edits %>%group_by(editor, half) %>%summarize(n_assigned = n()) %>%{ full_join(., crossing(editor = unique(.$editor), #can't get expand() to work.half = unique(.$half))) } %>%mutate(n_assigned = coalesce(n_assigned, 0L)) %>%ggplot(aes(x=half, y=n_assigned, fill=editor)) +geom_col(position="dodge") +geom_hline(yintercept = c(3, 6)) +xlab("Half / Year") + ylab("No. Issues Handled")+ hrbrthemes::theme_ipsum() + theme(legend.position = "bottom") + viridis::scale_fill_viridis(discrete = TRUE)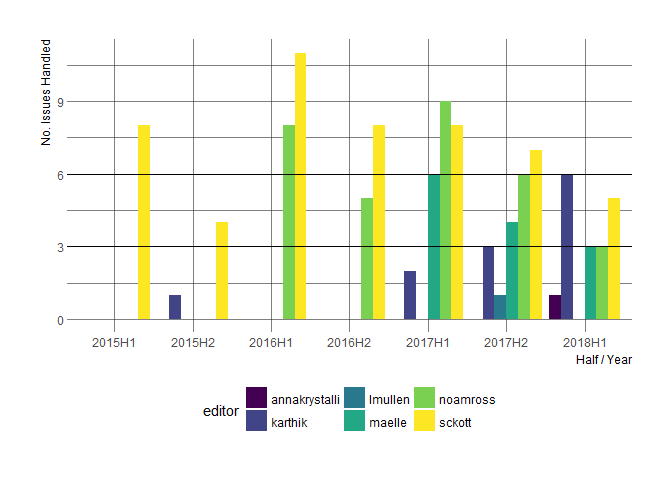
As an side-note, the same data allows to visualize the increase in thenumber of submissions.
edits %>%group_by(half) %>%summarize(n_submissions = n()) %>%ggplot(aes(x=half, y=n_submissions)) +geom_col(position="dodge") +xlab("Half / Year") + ylab("No. Submissions")+ hrbrthemes::theme_ipsum() 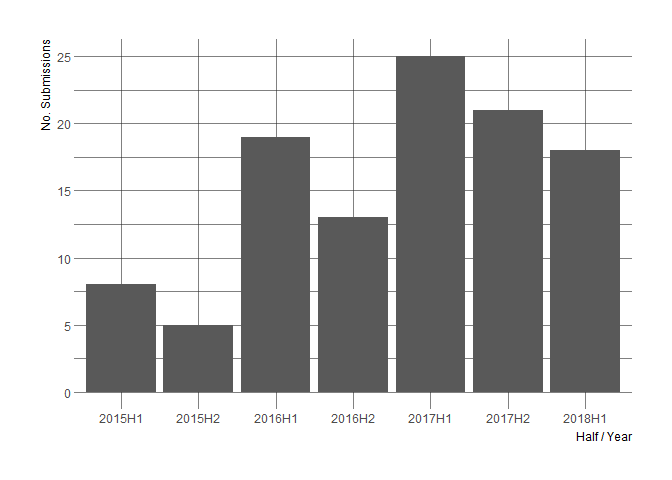
🔗Outlook: decreasing work by automation
As mentioned in this blog post about the authors and reviewerssurvey, we're inthe process of trying to maximize automation of all than can beautomated in order to reduce and simplify work for everyone involved.This way, humans can focus on what they're best at. Our currentautomation efforts include two packages in development: one for packageauthors, rodev, by rOpenScistaff, and one for package reviewers,pkgreviewr, by communitymember (and guest editor!) AnnaKrystalli. We also are working onautomating most of the checks that use goodpractice::gp so they arerun on CI infrastructure automatically on submission, rather thanrequiring editors to do so locally.
If you liked this data exploration, stay tuned for the third and finalpost of this series, about the social weather of onboarding ascharacterized by a tidy text analysis of onboarding threads! And don'tforget to check out the first post of the series, about datacollection,if you haven't read it yet.
Additional details
Description
Our onboarding process, thatensures that packages contributed by the community undergo atransparent, constructive, non adversarial and open review process,involves a lot of work from many actors: authors, reviewers and editors;but how much work ? Managing the effort involved in the peer-reviewprocess is a major part of ensuring its sustainability and quality.
Identifiers
- UUID
- a1bfb6ed-0526-4001-9999-8e5c2f32266f
- GUID
- https://doi.org/10.59350/jyyg7-rcm70
- URL
- https://ropensci.org/blog/2018/05/03/onboarding-is-work/
Dates
- Updated
-
2025-02-13T12:42:17Z
- Issued
-
2018-05-03T00:00:00Z