Veröffentlicht in A blog by Ross Mounce
Autor Ross Mounce

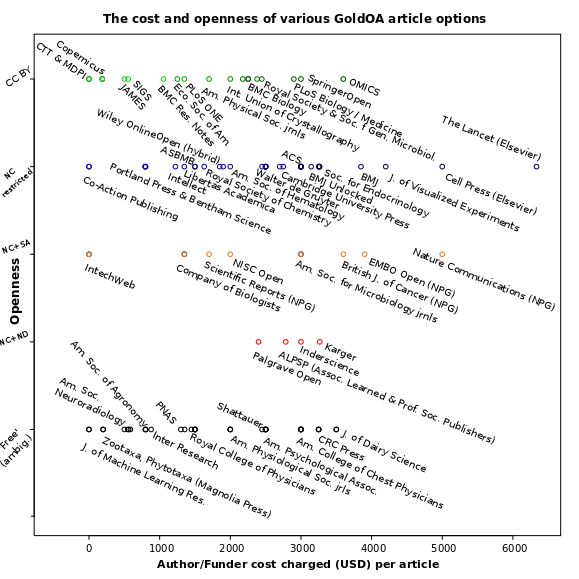
To try and publicize the variety of Gold Open Access article publication options on offer, I’ve decided to create a visualization of the journal data that has previously been collected as part of my survey of ‘Open Access’ publisher licenses’ spreadsheet. Here is version 0.1 of the ‘Mounce plot’ (much more data still to be added!