Veröffentlicht in dataand.me
Autor Mara Averick
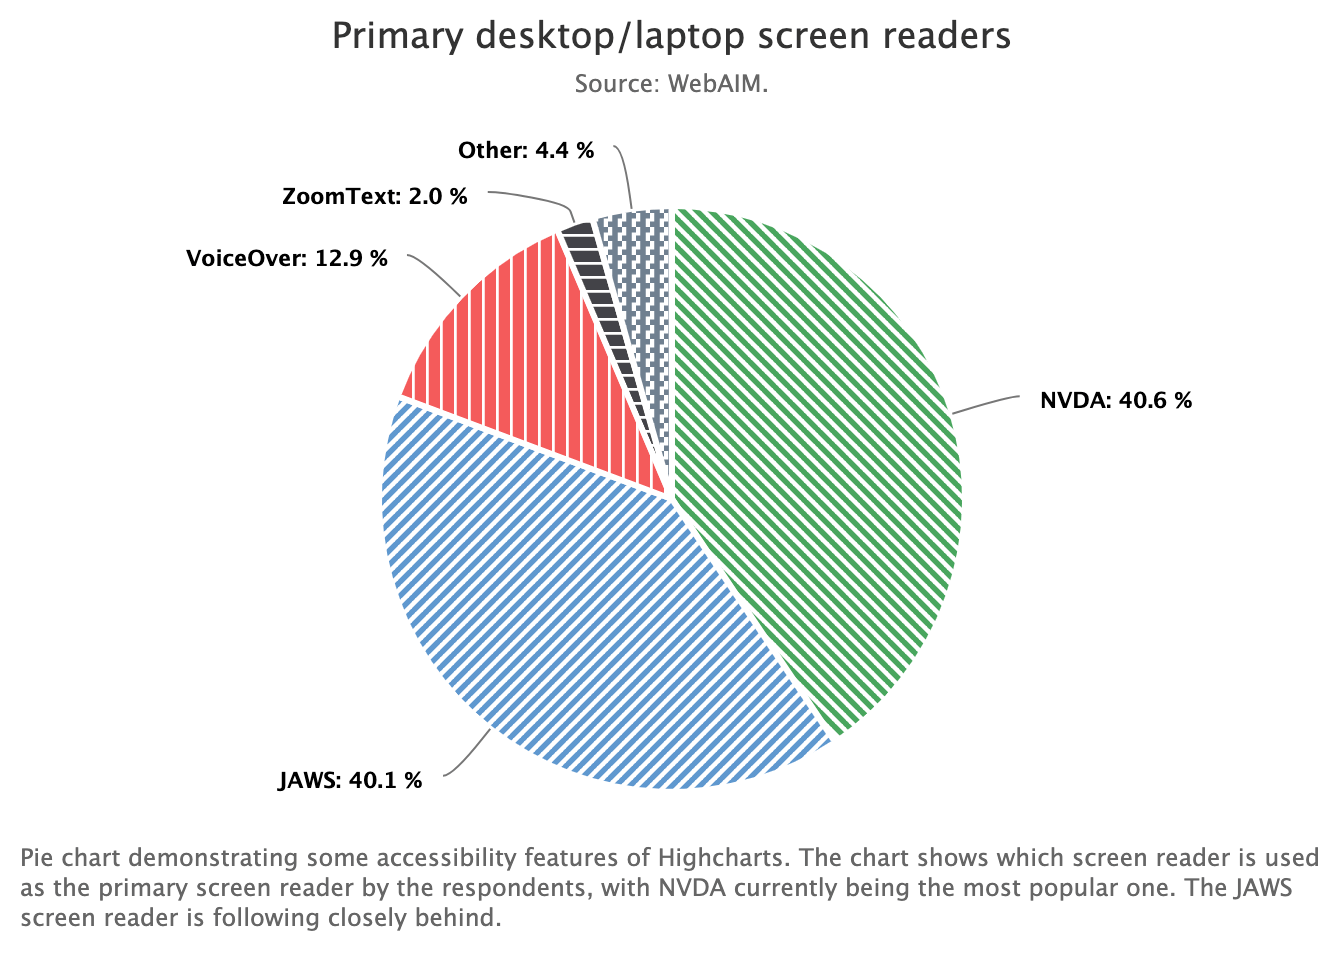
In the first two parts of this series we introduced the Highcharts accessibility module, the {highcharter} R package, and created some working examples with accessibility features turned on. Here, we’ll follow in the vein as part 2 by re-creating one of the accessible chart demos from Highcharts.