Rogue Scholar Beiträge

language
Veröffentlicht in Andrew Heiss's blog

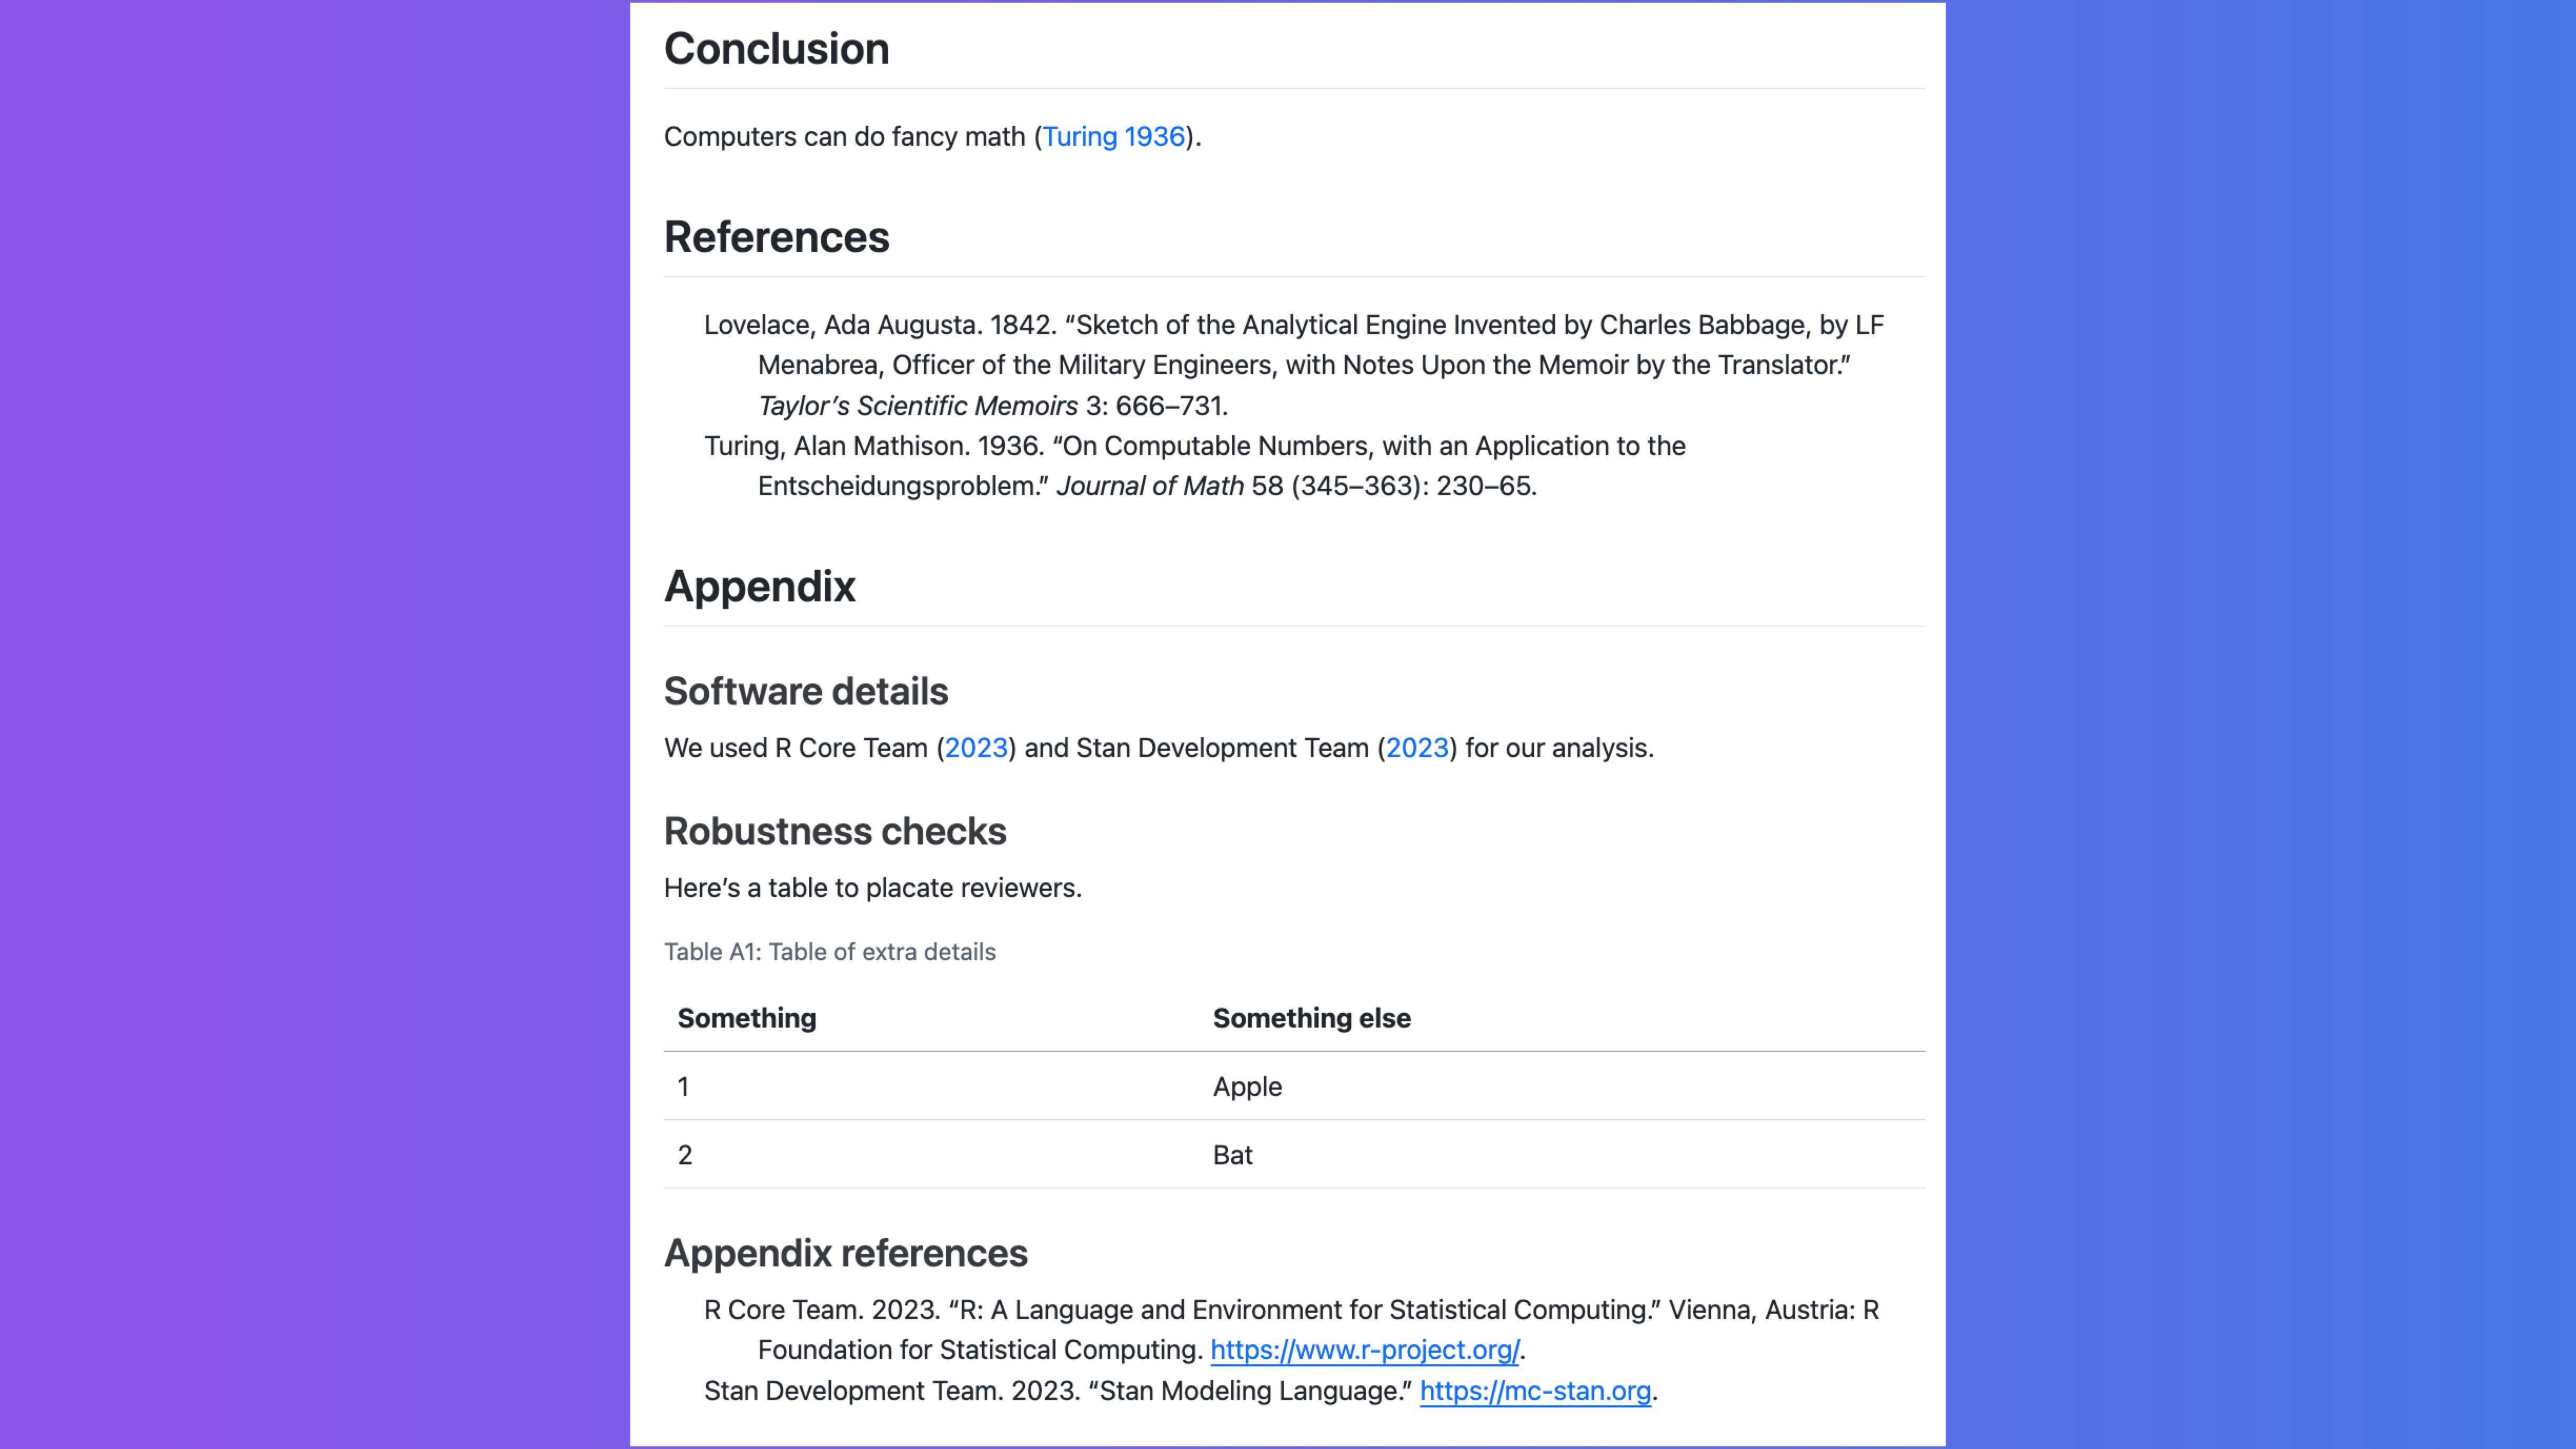
tl;dr If you want to skip the explanation and justification for why you might want separate bibliographies, you can skip down to the example section, or just go see some example files at GitHub. Why use separate bibliographies? In academic articles, it’s common to have a supplemental appendix with extra tables, figures, robustness checks, additional math, proofs, and other details.

Veröffentlicht in Blog - Blake Lee-Whiting
Autor Blake Lee-Whiting

[ { "type": "highlight", "id": "c2102369-87d1-40a6-a816-1269821725d8", "shape": "scribble", "isFront": false, "isAnimationEnabled": false, "animation": "draw", "duration": 0.5, "direction": "right", "color": { "type": "THEME_COLOR" }, "thickness": { "unit": "em", "value": 0.1 }, "linecap": "square" }, { "type": "highlight", "id": "93bf1d40-5a64-4a9b-948d-efd94079ae8f", "shape": "underline", "isFront": false, "isAnimationEnabled": false,

Veröffentlicht in Andrew Heiss's blog

I’ve been finishing up a project that uses ordered Beta regression (Kubinec 2022), a neat combination of Beta regression and ordered logistic regression that you can use for modeling continuous outcomes that are bounded on either side (in my project, we’re modeling a variable that can only be between 1 and 32, for instance). It’s possible to use something like zero-one-inflated Beta regression for outcomes like this, but that kind of model

Veröffentlicht in Andrew Heiss's blog

I recently posted a guide (mostly for future-me) about how to analyze conjoint survey data with R. I explore two different estimands that social scientists are interested in—causal average marginal component effects (AMCEs) and descriptive marginal means—and show how to find them with R, with both frequentist and Bayesian approaches. However, that post is a little wrong. It’s not wrong wrong, but it is a bit oversimplified.

Veröffentlicht in Andrew Heiss's blog

The students in my summer data visualization class are finishing up their final projects this week and I’ve been answering a bunch of questions on our class Slack. Often these are relatively standard reminders of how to tinker with specific ggplot layers (chaning the colors of a legend, adding line breaks in labels, etc.), but today one student had a fascinating and tricky question that led me down a realy fun dataviz rabbit hole.

Veröffentlicht in Andrew Heiss's blog

In my research, I study international nongovernmental organizations (INGOs) and look at how lots of different institutional and organizational factors influence INGO behavior. For instance, many authoritarian regimes have passed anti-NGO laws and engaged in other forms of legal crackdown, which has forced NGOs to change their programming strategies and their sources of funding.

Veröffentlicht in Andrew Heiss's blog

In a couple days, I’m going to drive across the country to Utah, my home state. I haven’t been out west with my whole family in four years—not since 2019 when we moved from Spanish Fork, Utah to Atlanta, Georgia. According to Google Maps, it’s a mere 1,900 miles (3,000 kilometers) through the middle of the United States and should take 28 hours, assuming no stops.

Veröffentlicht in Andrew Heiss's blog

I’ve been working on converting a couple of my dissertation chapters into standalone articles, so I’ve been revisiting and improving my older R code. As part of my dissertation work, I ran a global survey of international NGOs to see how they adjust their programs and strategies when working under authoritarian legal restrictions in dictatorship.