R is a language and environment for statistical computing.There are several tools and approaches for interacting with R, but not all are accessible with screen readers.This guide provides an overview of the tools and techniques available to screen reader users across different operating systems, with practical tips and resources to help them navigate the R environment.This guide may not be complete, but I hope it serves as a valuable starting
Messaggi di Rogue Scholar
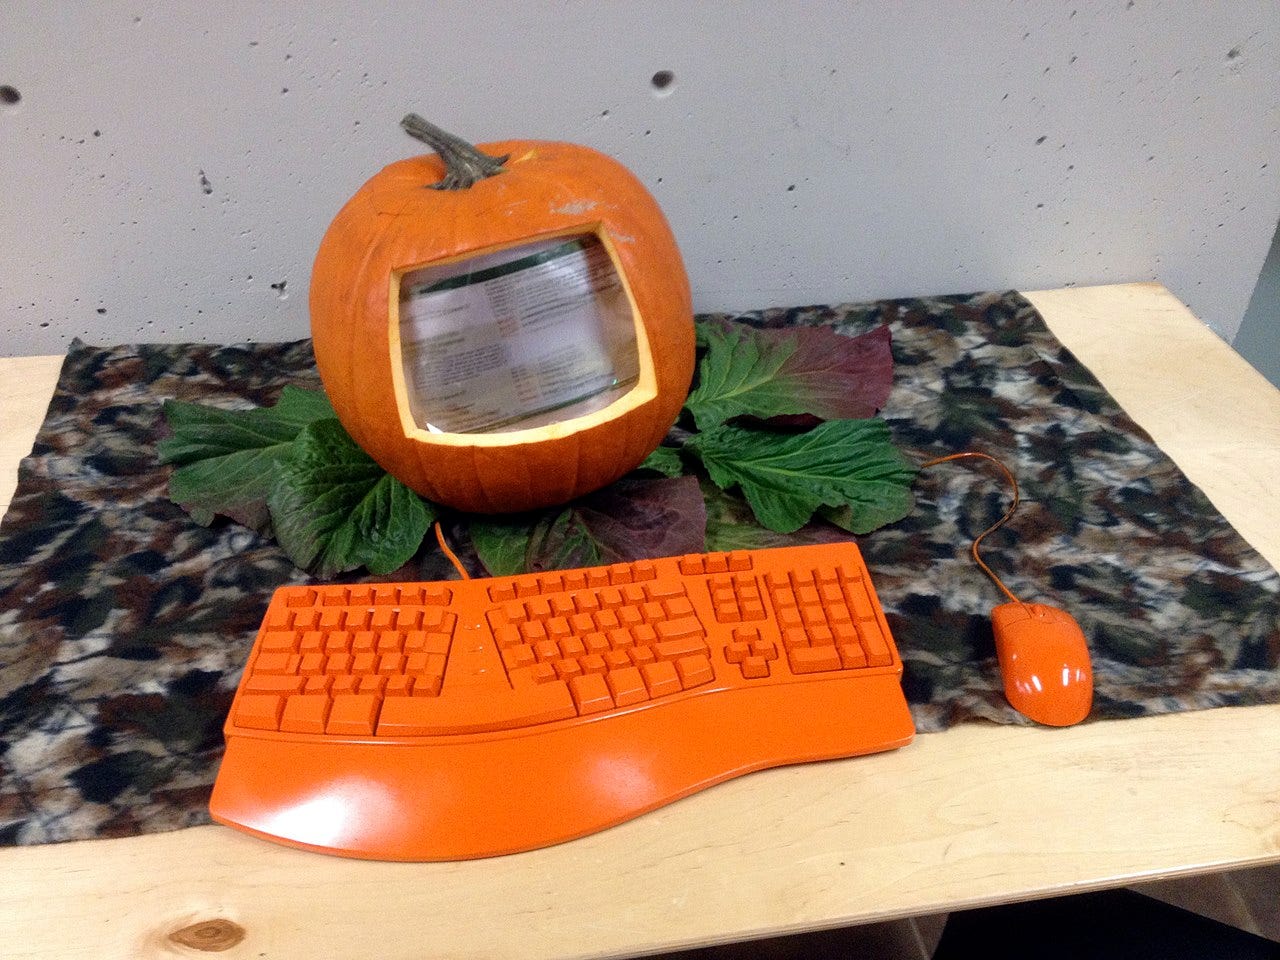
Hello everyone, welcome to today’s Halloween edition about data anti-patterns that hopefully will scare you so much you don’t do them :-) Things you better avoid when aiming for FAIR data. Anti patterns?

In another first for the novel GigaByte publication platform developed by River Valley Technologies, this week marks the first time multilingual articles have been simultaneously published in English, Spanish and Ukrainian Open Science has gained momentum over the past decade, and embracing that, GigaScience Press has aimed at pushing scientific publishing beyond just making articles open access toward making the entire process open
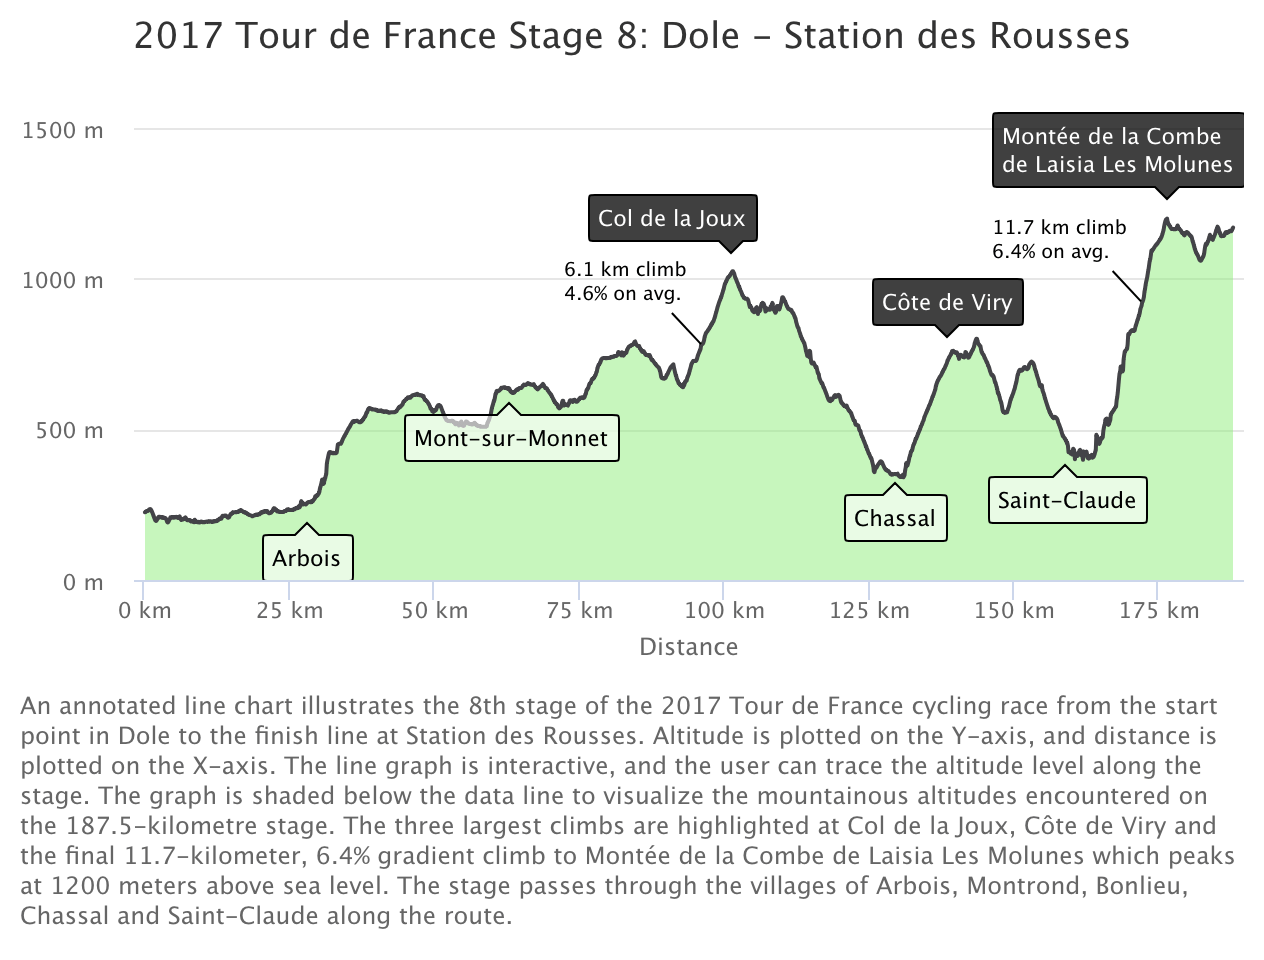
This final installment in our series on using the Highcharts accessibility module with {highcharter} is basically “extra credit.” (Read: I took the time to figure this out, so I’m sharing it. But, it’s probably not the most helpful post if you’re just trying to get the accessibility module working with {highcharter}.) We covered enabling the accessibility module, and getting basic keyboard navigation in part one.
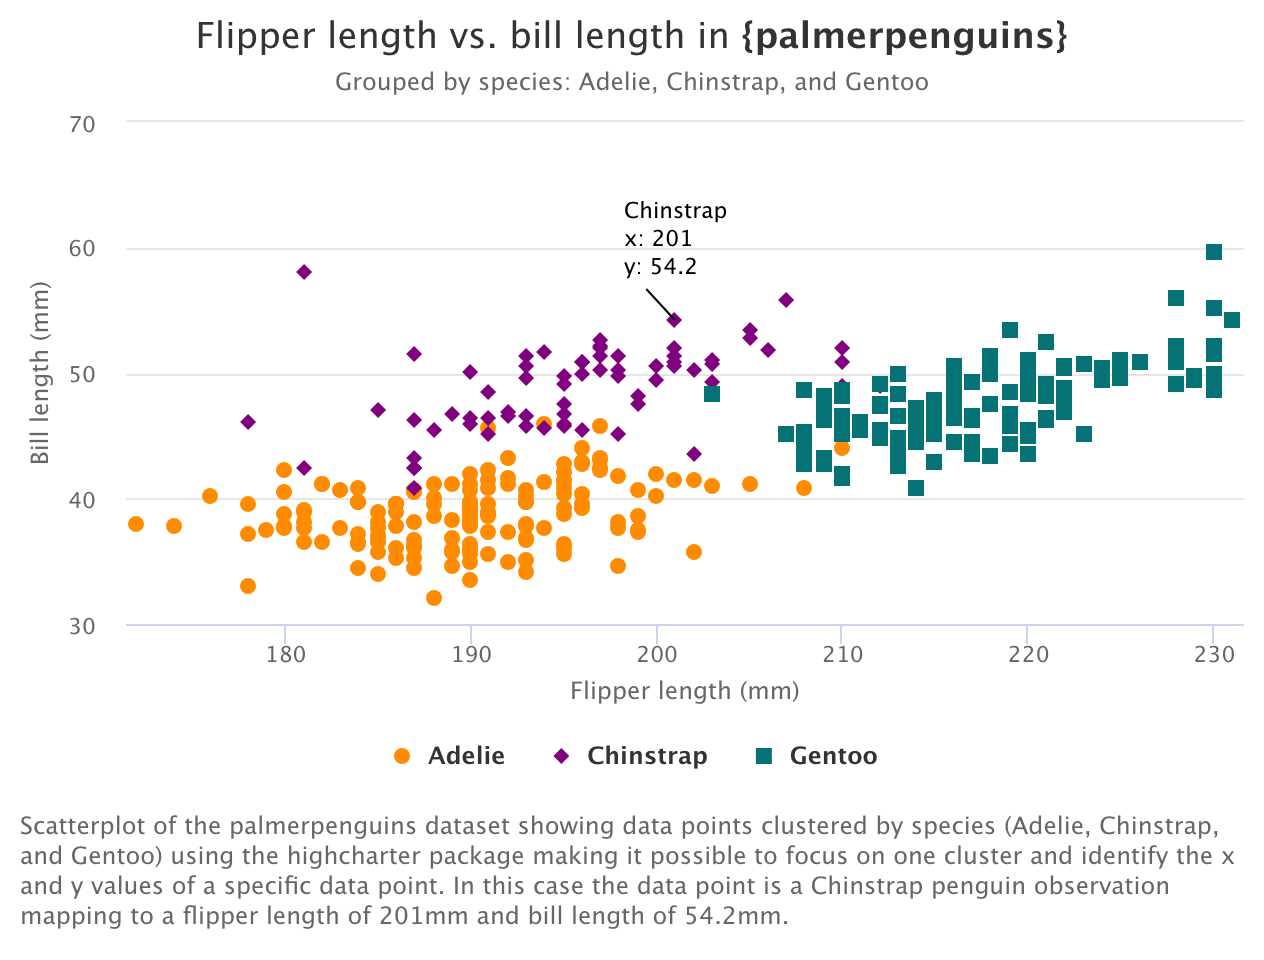
Back in the first post in this series I mentioned that the impetus for this whole endeavor was Silvia Canelón’s excellent collection of R-specific resources for making data visualizations more accessible (Canelón 2021). I wanted to fill the gap between the possibilities afforded by Highcharts’ accessibility module, and documented examples of module use with the {highcharter} package (Kunst 2021). Don’t worry, I have pull requests in the works
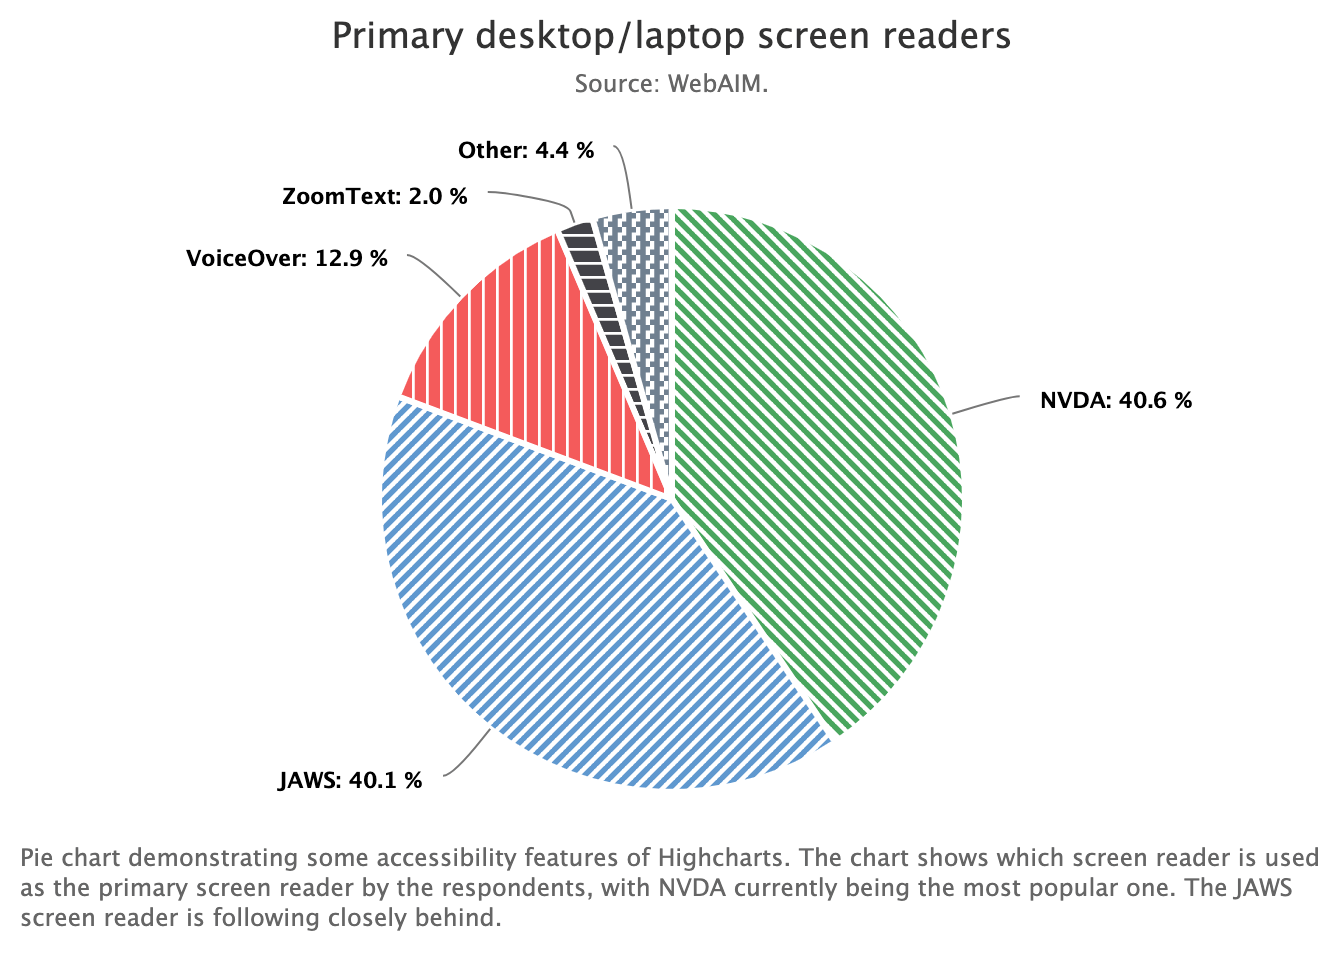
In the first two parts of this series we introduced the Highcharts accessibility module, the {highcharter} R package, and created some working examples with accessibility features turned on. Here, we’ll follow in the vein as part 2 by re-creating one of the accessible chart demos from Highcharts.
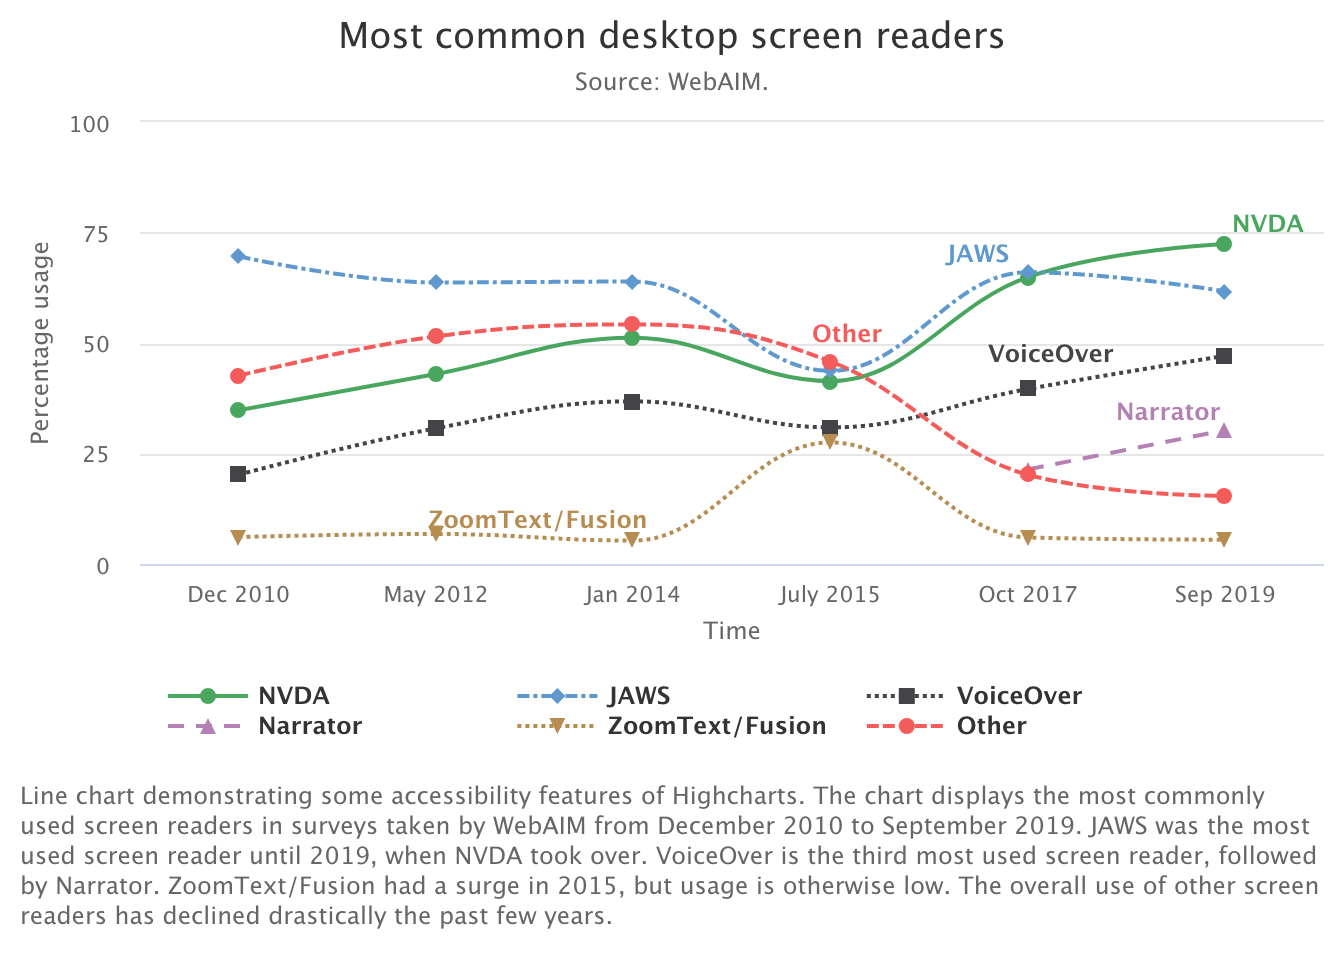
Today we’ll be using the Joshua Kunst’s {highcharter} package to re-create the first example from the Highcharts documentation for its accessibility module, an accessible line chart showing screen reader popularity over time, as an htmlwidget.
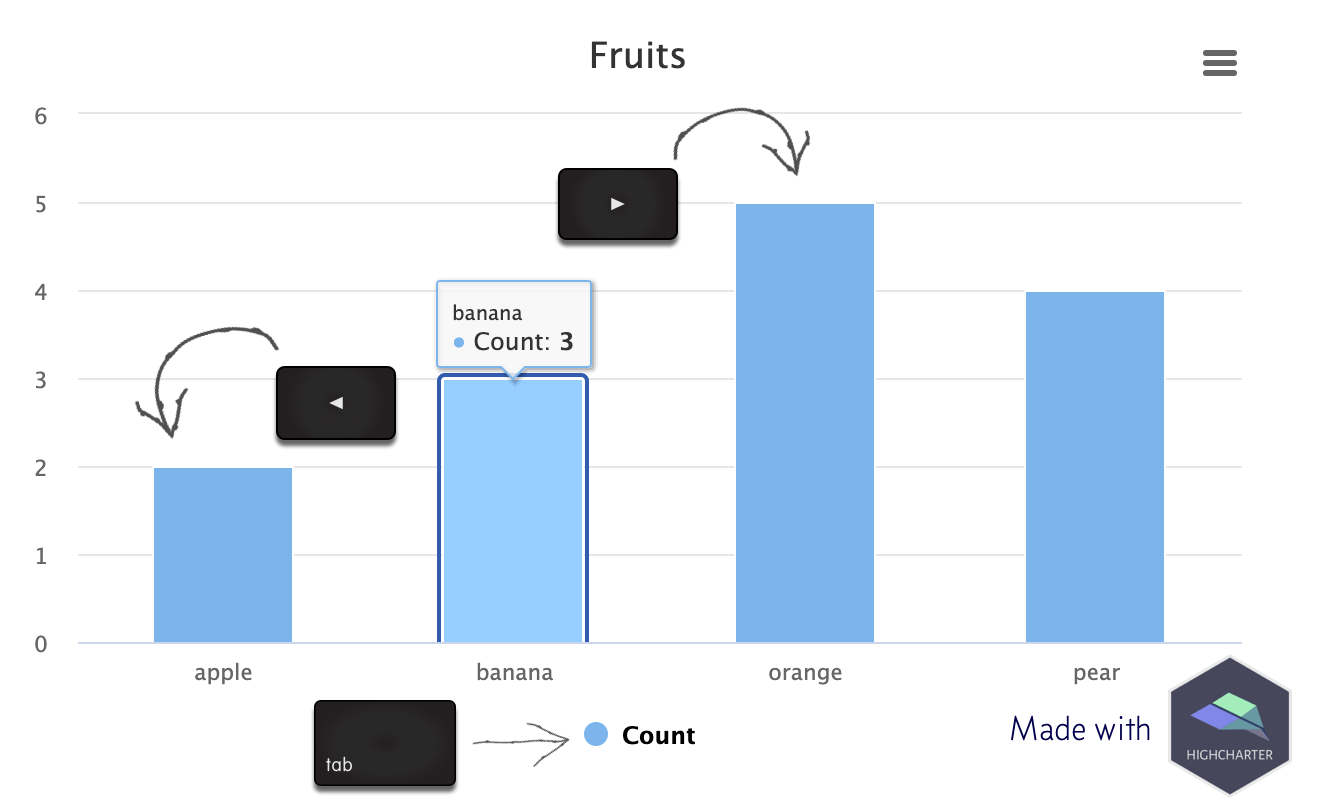
Over the past few weeks I’ve been experimenting with the accessibility module from Highcharts using the {highcharter} package by Joshua Kunst. Highcharts is an SVG-based library for making interactive charts for the web.

Cultural and individual differences of any kind should not make it harder to use software or technology in your everyday lives. Regretfully, it still very much does, as the default is that of an able-bodied white man in an overdeveloped country.
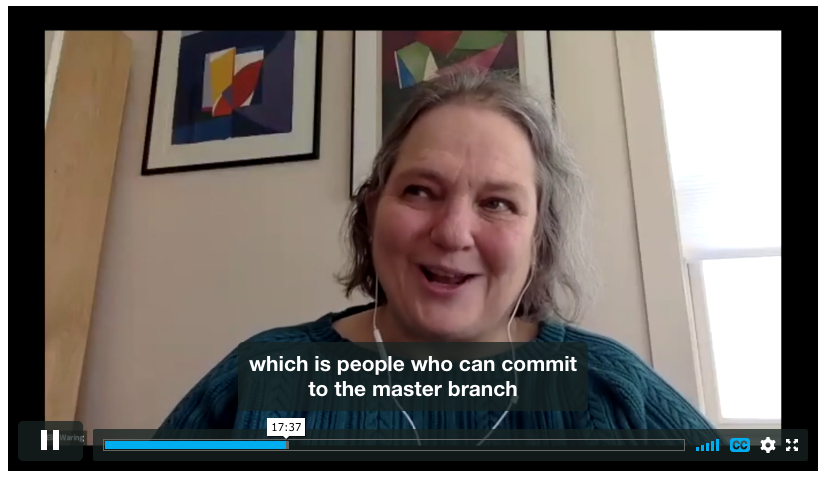
Webinars and community calls are a great way to gather many people to discuss a specific topic, without the logistic hurdles of in-person events. But whether online or in-person, to reach the broadest audience, all events should work towards greater accessibility.