I’ve worked for over 12 years in hydrology and natural hazard modelling and one of the things that still fascinates me is the variety of factors that come into play in trying to predict phenomena such as river floods.

I’ve worked for over 12 years in hydrology and natural hazard modelling and one of the things that still fascinates me is the variety of factors that come into play in trying to predict phenomena such as river floods.

Do you fancy open data, R, and breathing? Then you might be interested in ropenaq which provides access to open air quality data via OpenAQ! Also note that in French, R and air are homophones, therefore we French speakers can make puns like the one in the title.

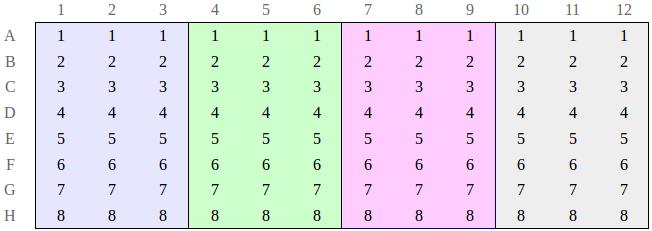
As a lab scientist, I do almost all of my experiments in microtiter plates. These tools are an efficient means of organizing many parallel experimental conditions. It’s not always easy, however, to translate between the physical plate and a useful data structure for analysis. My first attempts to solve this problem–nesting one ifelse call inside of the next to describe which well was which–were very unsatisfying.

Academia.edu takes your academic work and puts it behind a privacy-defying signup form, laces it with ads, botches the metadata, and tries to appease you by offering stats and social ranking that promote constant comparison. What’s not to like?

If you have an Android phone like me, you probably use Google Calendar. I like the way it integrates with my contacts so that I can schedule events with people. I like the idea of it integrating with my Google+ contacts to automatically create a calendar of birthdays that I don’t want to miss. There’s a glitch in that, but I’ve created a new app to get around it, called Selected Birthdays.

It’s that time again! A bunch of really eager computer scientists have a prototype that will translate sign language to speech! They’ve got a really cool video that you just gotta see ! They win an award! (from a panel that includes no signers or linguists). Technology news sites go wild!

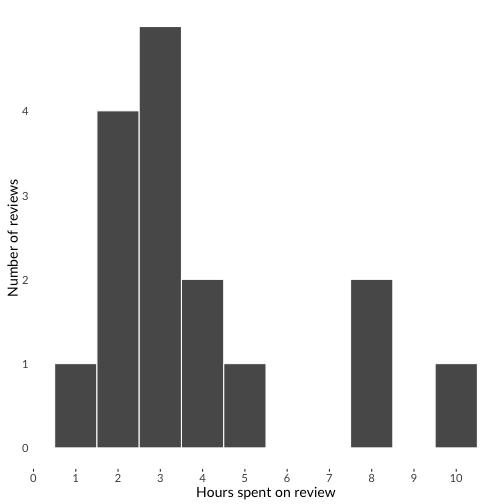
Code review, in which peers manually inspect the source code of softwarewritten by others, is widely recognized as one of the best tools for findingbugs in software. Code review is relatively uncommon in scientific softwaredevelopment, though.

A while back, I mentioned that I’d written and released VertFigure, a program for drawing schematic comparative diagrams of vertebral columns.

Five days ago, I released a program for drawing comparative figures of vertebral columns, such as this one from our neural-spine bifurcation paper. With my idiot computer-scientist hat on, I gave that program the startlingly unmemorable name vcd2svg — the reasoning being that it takes Vertebral Column Descriptions and translates them into Scalable Vector Graphics.

I think it’s fair to say that this “bifurcation heat-map”, from Wedel and Taylor (2013a: figure 9), has been one of the best-received illustrations that we’ve prepared: {.aligncenter .size-full .wp-image-8009 loading=“lazy” attachment-id=“8009” permalink=“http://svpow.com/papers-by-sv-powsketeers/wedel-and-taylor-2013-on-sauropod-neural-spine-bifurcation/wedel-and-taylor-2013-bifurcation-figure-9-bifurcatogram/”