Publicados in iPhylo
Autor Roderic Page

A challenge in working with large taxonomic classifications is how you display them to the user, especially if the user probably doesn't want all the gory details.
A challenge in working with large taxonomic classifications is how you display them to the user, especially if the user probably doesn't want all the gory details.

It's funny how some images stick in the mind. A few years ago Chris Freeland (@chrisfreeland), then working for Biodiversity Heritage Library (BHL), created a visualisation of BHL content relevant to the African continent. It's a nice example of small multiples. For more than a decade (gulp) I've been extracting articles from the BHL and storing them in BioStor.
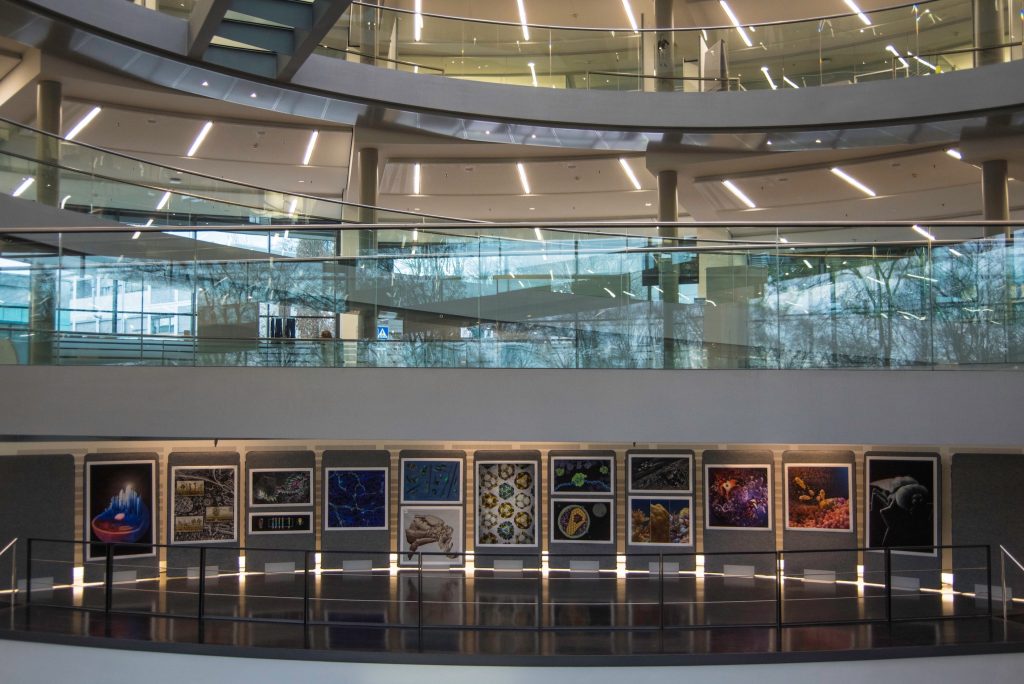
The 10th anniversary of the EMBO Workshop: Visualising Biological Data (VIZBI 2019) took place in EMBL in Heidelberg last week. GigaScience Data Scientist Chris Armit was there and was astonished at the cinematic quality of the visualisations that were showcased over this 3-day meeting.

Continuing my on-again off-again relationship with the Semantic Web, I stumbled across a cool approach to visualising the results of SPARQL queries.
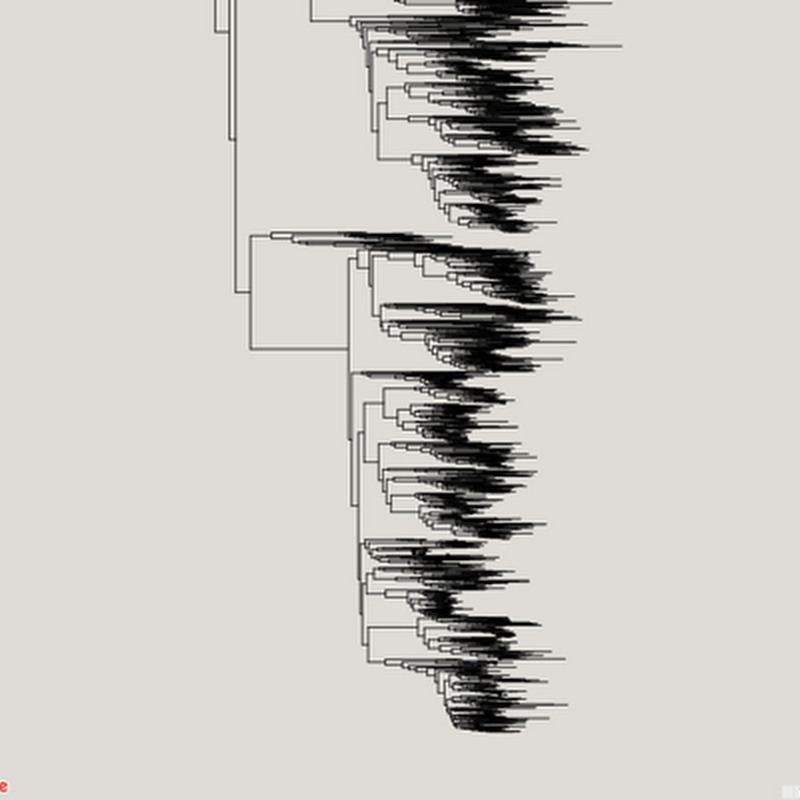
Inspired in part by the release of the draft tree of life (doi:10.1073/pnas.1423041112 by the Open Tree of Life, I've been revisiting (yet again) ways to visualise very big phylogenies (see Very large phylogeny viewer for my last attempt). My latest experiment uses Google Maps to render a large tree. Google Maps uses "tiles" to create a zoomable interface, so we need to create tiles for different zoom levels for the phylogeny.
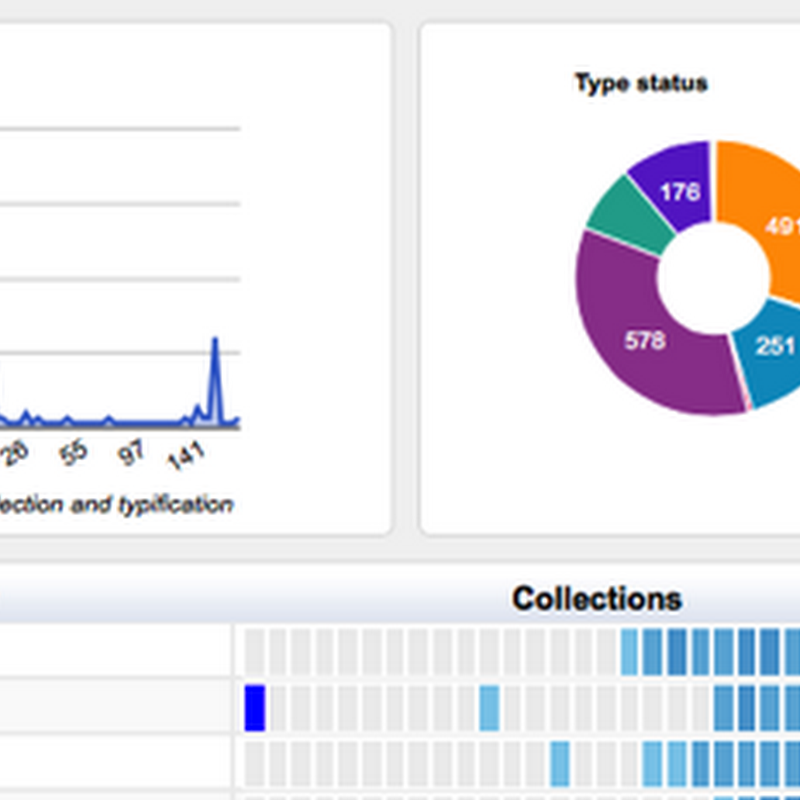
I'm adding more charts to the GBIF Chart tool, including some to explore the type status of specimens from the Solomon Islands.
Following on from the previous post on visualising GBIF data, I've added some more interactivity.
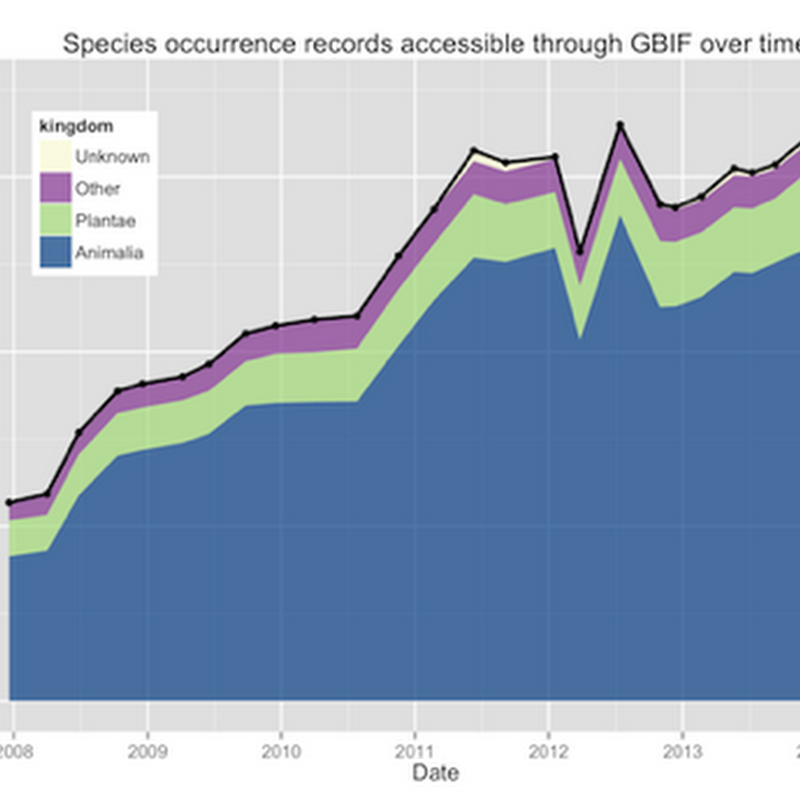
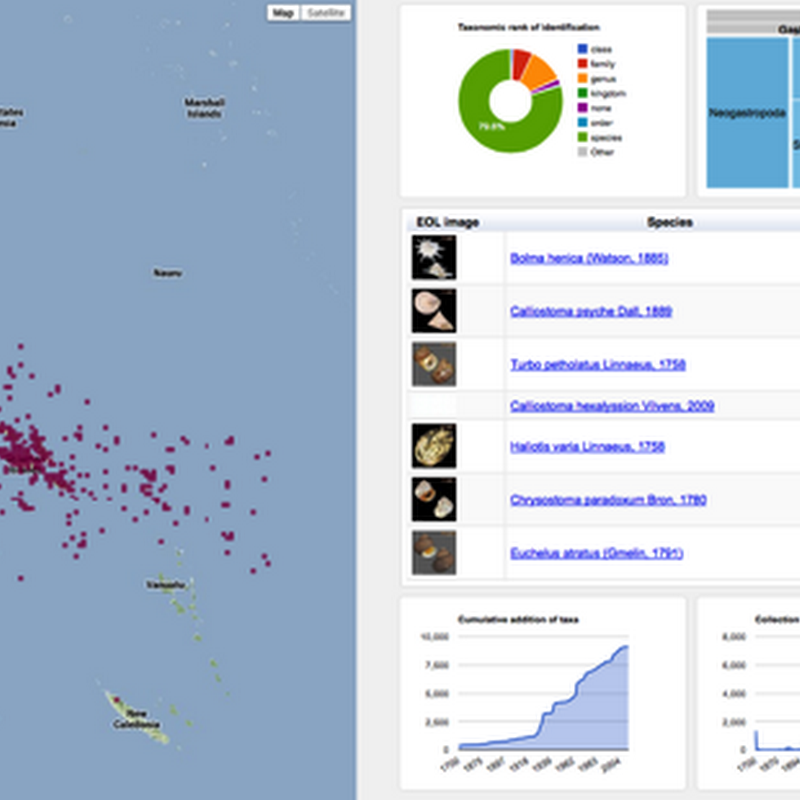
Tim Roberston and the ream at GBIF are working on some nice visualisations of GBIF data, and have made an early release available for viewing: http://analytics.gbif-uat.org.
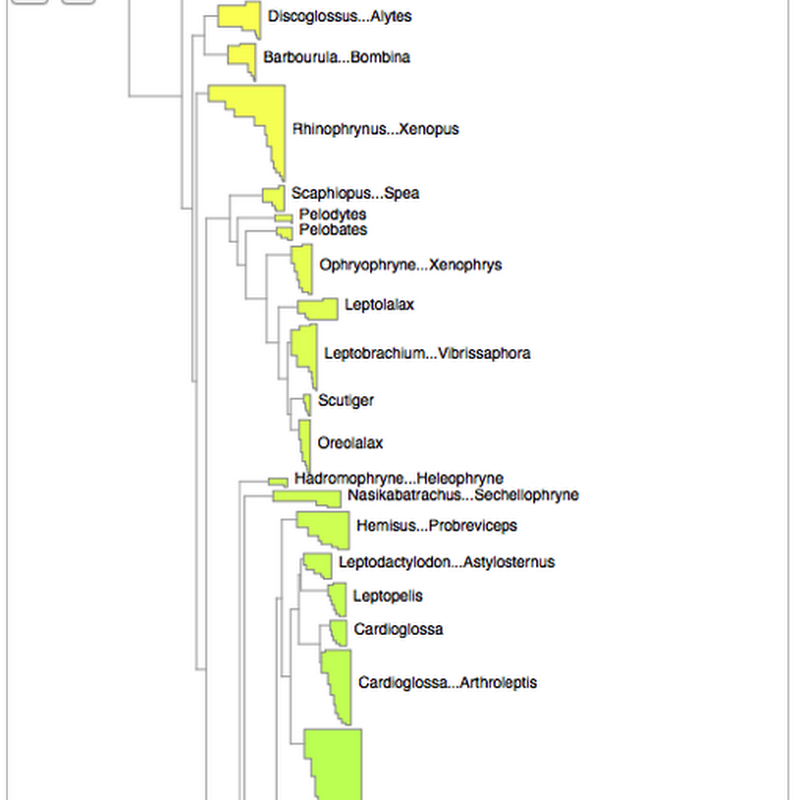
As announced on phylobabble I've started to revisit visualising large phylogenies, building on some work I did a couple of years ago (my how time flies). This time, there is actual code (see https://github.com/rdmpage/deep-tree) as well as a live demo http://iphylo.org/~rpage/deep-tree/demo/. You can see the amphibian tree below at http://iphylo.org/~rpage/deep-tree/demo/show.php?id=5369171e32b7a:You can upload or paste a tree (for now in NEXUS

James Rosindell's OneZoom tree viewer is out and the paper describing the viewer has been published in PLoS One (disclosure, I was a reviewer):Below is a video where James describes OneZoom.OneZoom is fun, and is deservedly attracting a a lot of attention. But as visually striking as it is, I confess I have reservations about fractal-based viewers. For a start they make it hard to get a sense of the relative size of taxonomic groups.