
Open NMR: Nick Day's misassignment detector plot
Creators & Contributors

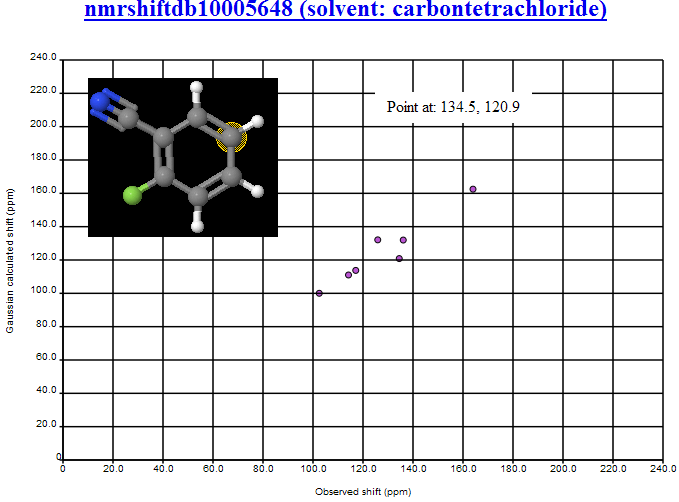
It has become clear that a number of structures in the NMRShiftDB data set probably have misassigned peaks. A very common situation is where two peaks are misassigned to a pair of atoms (i.e. peakA is assigned to atomA and peakB to atomB, where it should be peakA to atomB and peakB to atomA). This has a fairly characteristic pattern on the obs vs. calc plot if the effect is large:
where the peak (134 ppm) should be assigned to the atom ortho to the CN and the peak 125 should be assigned to the circled atom.
When the efect is smaller it's easier to miss, so Nick has transformed the data by plotting X = (obs + calc)/2 and Y = calc – obs. (equivalent to rotating the data by 45 deg clockwise) It's the same data but the effect is then dramatic.
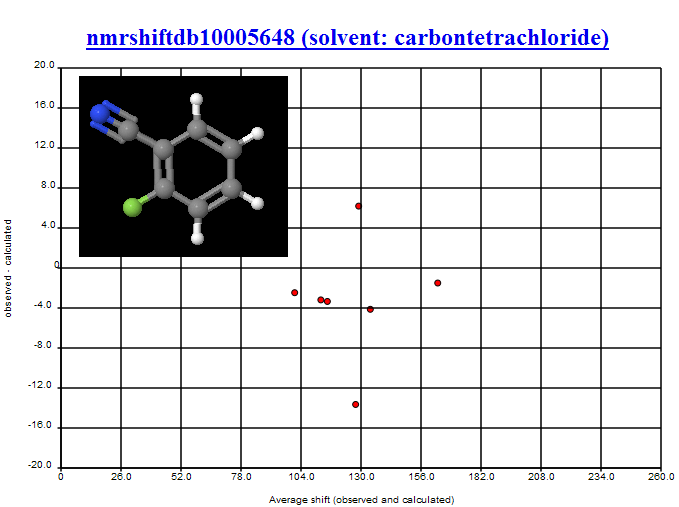
The misassignment is marked by two peaks at the same average value but displaced roughly equal amounts above and below the rest of the data. It's also much clearer what the offset is – this data runs at approximately -3 +- 1 ppm – i.e. the precision seems to be very high.
The offset could be due to errors in reporting the shift, errors in using/calculating TMS (if it was used to calibrate) or other absolute errors in the GIAO method. But it's clear that within a particular sample assignments can be validated to limits of 1-2 ppm. That's good news if it's universal.
Additional details
Description
It has become clear that a number of structures in the NMRShiftDB data set probably have misassigned peaks. A very common situation is where two peaks are misassigned to a pair of atoms (i.e. peakA is assigned to atomA and peakB to atomB, where it should be peakA to atomB and peakB to atomA). This has a fairly characteristicÂ
Identifiers
- GUID
- https://blogs.ch.cam.ac.uk/pmr/?p=798
- URL
- https://blogs.ch.cam.ac.uk/pmr/2007/11/06/open-nmr-nick-days-misassignment-detector-plot/
Dates
- Issued
-
2007-11-06T20:10:00Z
- Updated
-
2007-11-06T20:10:00Z