Unveiling Research Trends through OpenAlex Visualization

Exploring the OpenAlex Data Structure and Visualization
Author:
- Qingqin Fang (ORCID: 0009–0003–5348–4264)
Introduction to OpenAlex
In today's world, the realm of research papers is brimming with countless hot topics, and the sheer volume of publications can be overwhelming. For beginners who are still finding their research footing or seasoned researchers looking to explore new directions, the challenge of identifying the next big research trend to shape their path looms large.
A Comprehensive Scholarly Resource OpenAlex, stemming from Microsoft Academic Graph (MAG) introduced in 2015, transitioned into its own entity in 2021. This database stands as a beacon of knowledge and insight, offering a vast array of scholarly entities, including papers, authors, institutions, concepts, and publications. Its all-encompassing nature provides a holistic view of the scholarly landscape, making it a valuable resource for researchers and academics alike.
This post serves as a guide to understanding the fundamentals of the OpenAlex database and harnessing the power of data visualization to uncover research trends and hotspots. By exploring the data structure and visualization capabilities of OpenAlex, researchers can gain valuable insights, identify emerging research areas, and make informed decisions about their research directions.
OpenAlex Data Structure
Similar to most graph databases, OpenAlex stores data in a graph structure interconnected by nodes and edges, resembling a digital spiderweb:
- Nodes: different scholarly entities like papers, authors, institutions, and concepts.
- Edges: relationships between entities, such as co-authorship among authors or citation links for papers.
Let's take a closer look at the essential details. As the OpenAlex database continues to grow and expand, an increasing number of entities are being stored, including:
- Works: Academic literature like journal articles, books, datasets, and theses
- Authors: Creators of scholarly works
- Venues: Hosting platforms for works, such as journals, conferences, and repositories
- Institutions: Universities and other affiliations claimed by authors
- Concepts: Themes assigned to works
- Publishers: Entities responsible for disseminating works
- Funders: Organizations supporting research endeavors
- Geography: Spatial locations associated with entities
In the subsequent articles, we mainly focus on the entities of Works and Concepts.
Accessing OpenAlex
OpenAlex provides multiple ways to interact with its data. The primary method is to access the OpenAlex website directly for conducting relevant searches. Alternatively, for a more developer-friendly approach, you can utilize the OpenAlex API.
For each search on OpenAlex, specific entities are necessary, such as works, authors, venues, institutions, topics, publishers, funders, and geography. The basic search API format follows the pattern "https://api.openalex.org/" + the corresponding entity name. Additionally, advanced filtering and search based on conditions are supported. In this instance, our focus will be on exploring topics. For more detailed information on the API functionalities, please refer to the OpenAlex technical documentation.
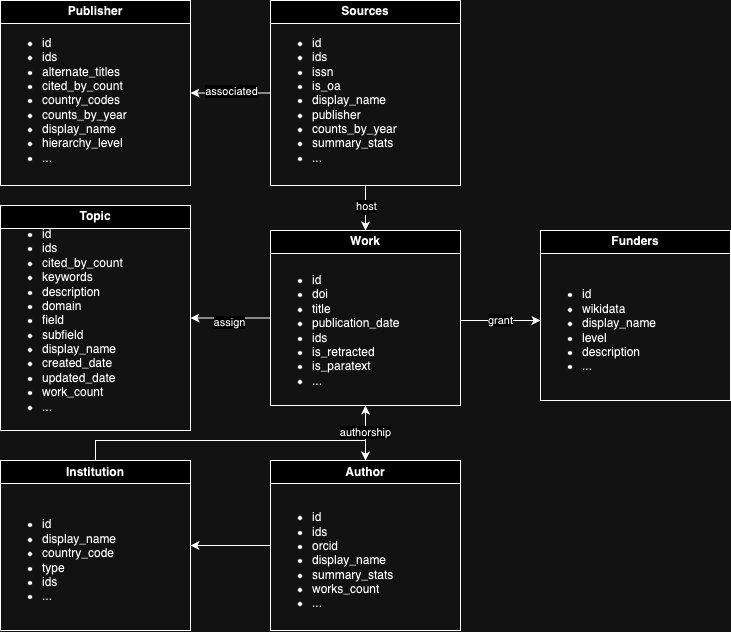
When utilizing the API, Works in OpenAlex are categorized with topics using an automated system that takes into account various work details such as title, abstract, source (journal) name, and citations. There are approximately 4,500 topics in OpenAlex, organized into subfields, which are further grouped into fields, and then into top-level domains. The diagram below illustrates this hierarchical structure, along with the respective counts for each level.
Here's how we can retrieve Fields data using Python:
import requests
import json
# The URL of the OpenAlex API endpoint to retrieve field
openalex_api = "https://api.openalex.org/"
# Send a GET request to the API endpoint to retrieve field
main_fields = requests.get(openalex_api+"fields").json()
print(main_fields)
We can get the result json data like:
{meta: {'count': 26, 'db_response_time_ms': 2, 'page': 1, 'per_page': 25,
'groups_count': None}
results: [{'id': 'https://openalex.org/fields/27', 'display_name': 'Medicine',
 'description': 'field of study for diagnosing, treating and preventing disease',
'ids': {'wikidata': 'https://www.wikidata.org/wiki/Q11190',
'wikipedia': 'https://en.wikipedia.org/wiki/Medicine'},
'display_name_alternatives': ['healthcare sciences'],
'domain': {'id': 'https://openalex.org/domains/4', 'display_name': 'Health Sciences'},
 'subfields': [{'id': 'https://openalex.org/subfields/2702',
'display_name': 'Anatomy'},,…]…]
group_by: []}
Visualization Using Python
Programming languages like Python provide a convenient way to visualize OpenAlex data. By leveraging libraries such as pandas, matplotlib, and seaborn, we can create various charts to gain insights from the data.
import pandas as pd
import matplotlib.pyplot as plt
import seaborn as sns

# Extract field data from the response
field_data = main_fields['results']
# Create a Pandas DataFrame from the field data
df_main_field = pd.DataFrame(field_data)
# Shorten the 'display_name' column name for better readability
df_main_field = df_main_field.rename(columns={'display_name': 'Field of Study'})

# Create the bar chart with title and legend
plt.figure(figsize=(12, 6)) # Adjust figure size for better readability
sns.barplot(x='Field of Study', y='works_count', data=df_main_field, palette='Set3')
plt.yscale("log") # Logarithmic scale for skewed data

# Adjust x-axis labels to prevent overlapping and improve readability
plt.xticks(fontsize=10, rotation=45, ha="right") # Adjust font size and rotation

# Add title and labels with consistent variable names
plt.title("Number of Works by Field of Study (OpenAlex)")
plt.xlabel("Field of Study")
plt.ylabel("Work Count (Log Scale)")
plt.legend(title="Fields of Study") # Add legend title
plt.tight_layout() # Adjust spacing for better visualization
plt.show()
After running the above code, the generated visualization displays the number of works by field of study in OpenAlex. The bar chart showcases the distribution of works across different fields, with the y-axis representing the work count on a logarithmic scale for better visualization. The x-axis labels are adjusted for improved readability, and the chart is accompanied by a title, axis labels, and a legend indicating the fields of study.

In the visualization, we observe that the "medicine" topic has the highest number of published works, exceeding 70 million. Additionally, research is gradually shifting towards a more human-centric focus in areas such as social science, engineering, and arts and humanities.
Python is suitable for creating complex charts and conducting in-depth analysis, offering high customization and meeting diverse needs. Apart from the basic matplotlib library, Python also provides specialized libraries like networkx for more rigorous research and visualization.
VOSViewer
We also have a more professional tool for visualizing literature citation networks and collaboration networks, VOSviewer. It is user-friendly for non-experts, easy to operate, and capable of displaying relationships between authors, keywords, and literature. VOSviewer primarily focuses on scientific research and academic literature networks, particularly emphasizing citation relationships and collaboration networks.
VOSviewer is a user-friendly tool developed by van Eck and Waltman from the Centre for Science and Technology Studies at Leiden University in 2009. It is a free software based on JAVA that specializes in visualizing scientific research and academic literature networks, particularly focusing on citation and collaboration relationships.
For local installation, users need to have JAVA 8 or higher installed, and also the VOSviewer installation package.
For web-based usage, users can download the vosviewer.jnlp file and launch it.
VOSviewer offers various types of relationship graphs such as co-authorship networks, keyword co-occurrence networks, institution collaboration networks, paper cluster analysis, and citation networks. The visualizations provided by VOSviewer include network visualization (cluster view), overlay visualization (label view), and density visualization.
Taking the API data from VOSViewer related research as an example, we can visualize its topics.
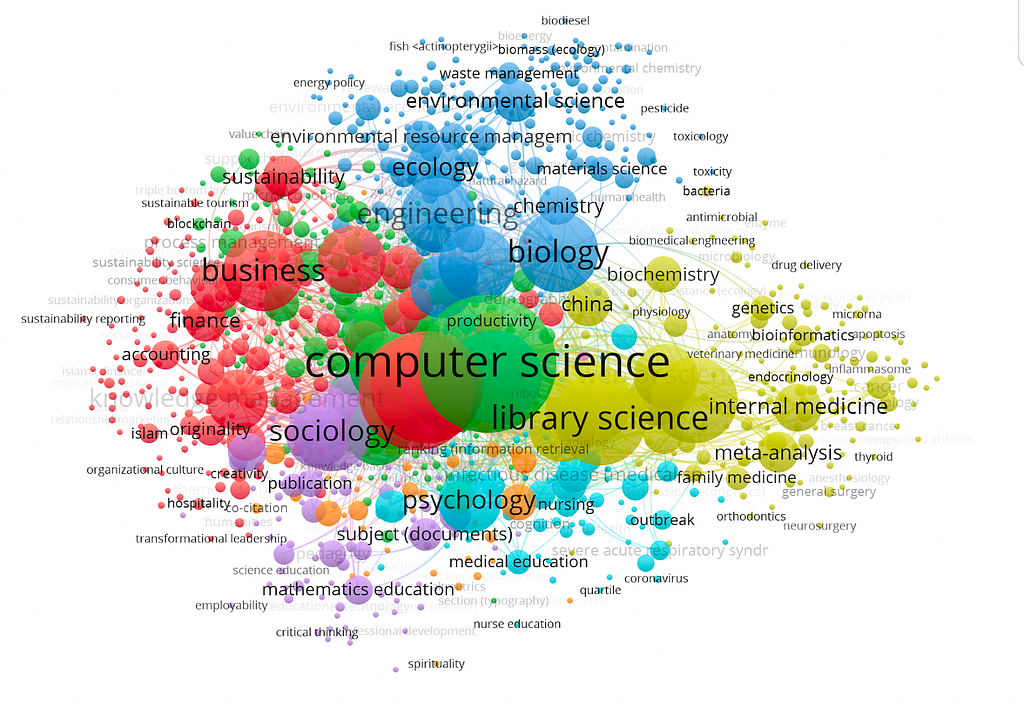
Specifically, VOSviewer provides three types of visualization views: network visualization, overlay visualization, and density visualization.
In the cluster view, elements consist of circles and labels where the size of an element depends on factors like node degree, link strength, and citation count. The color of an element represents its cluster, with different clusters shown in different colors. This view allows for exploring individual clusters to identify research hotspots, small research groups through author collaboration, and differences in scholars' views on research topics through author coupling networks.

The label view allows users to assign different colors to nodes based on their research needs using the score or color fields in the map file. By default, nodes are colored based on the average year of keywords.

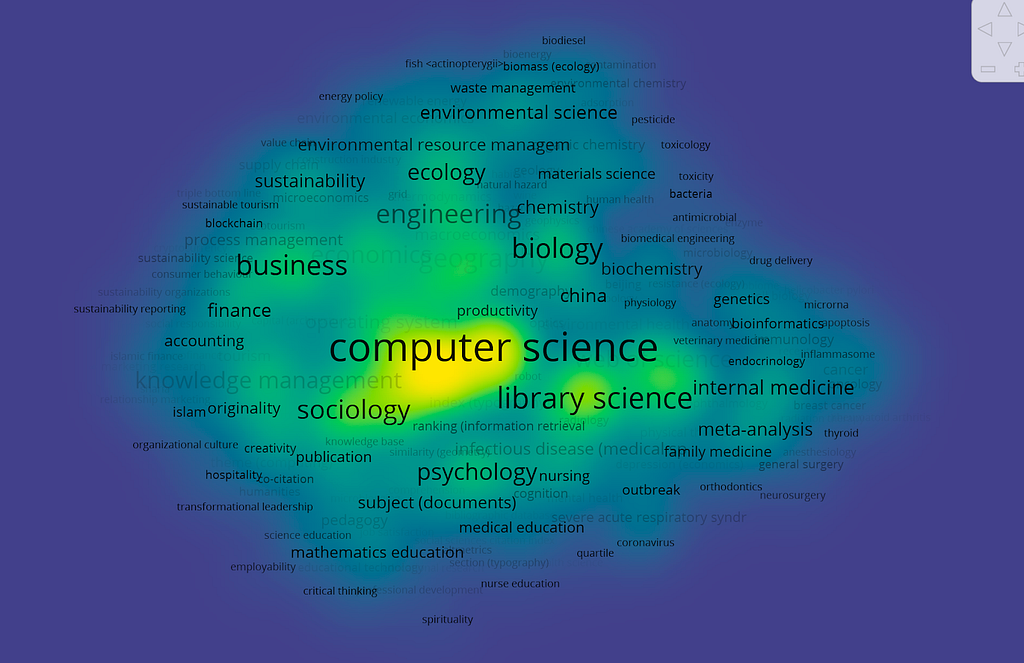
Density visualization fills each point on the graph with color based on the density of surrounding elements. Higher density is closer to red, while lower density is closer to blue. This view helps quickly observe important areas and the density of knowledge and research in a particular field.
VOSviewer is a user-friendly and effective tool tailored for visualizing literature citation networks and collaboration networks in scientific research. Its emphasis on relationships between authors, keywords, and literature, coupled with various visualization views such as cluster, label, and density, makes it a valuable resource for researchers and academics. With a focus on simplicity and specialized features, VOSviewer stands out as a dedicated solution for gaining insights into scholarly connections.
Conclusion
In conclusion, navigating the vast landscape of scholarly research has become more accessible and insightful with the aid of tools like OpenAlex and VOSviewer. By unraveling the data structures within OpenAlex and harnessing the power of Python for visualization, researchers can uncover trends and hotspots in various fields of study. The combination of OpenAlex's extensive database and Python's flexibility enables a nuanced exploration of research landscapes. Additionally, the user-friendly and specialized features of VOSviewer provide an alternative avenue for delving into literature citation and collaboration networks, offering a valuable resource for researchers to navigate the ever-evolving world of scholarly connections. Together, these tools empower researchers to make informed decisions, identify emerging areas, and contribute meaningfully to the dynamic realm of academic exploration.
References
- Tonmoy, S. M. T. I., Zaman, S., Jain, V., Rani, A., Rawte, V., Chadha, A., & Das, A. (2024). A comprehensive survey of hallucination mitigation techniques in large language models. arXiv (Cornell University). https://doi.org/10.48550/arxiv.2401.01313
- Overview | OpenAlex technical documentation. (n.d.). https://docs.openalex.org/
- Nees, J. V. E., & Waltman, L. (2018). VOSViewer Manual. https://www.vosviewer.com/documentation/Manual_VOSviewer_1.6.8.pdf
- Levallois, C., Nees Jan van Eck, & Ludo Waltman. (2017). A tutorial for vosviewer. https://seinecle.github.io/vosviewer-tutorials/generated-pdf/importing-en.pdf
- OurResearch. (2023, December 14). Webinar: OpenAlex and VOSViewer: Uniting to enable free, easy, and high-quality research analytics [Video]. YouTube. https://www.youtube.com/watch?v=MfwFzLQmUwo
Additional details
Description
Exploring the OpenAlex Data Structure and Visualization Author: Qingqin Fang ( ORCID: 0009–0003–5348–4264) Introduction to OpenAlex In today's world, the realm of research papers is brimming with countless hot topics, and the sheer volume of publications can be overwhelming.
Identifiers
- UUID
- 443f0a1a-d3ba-4980-9ed2-9f7d2e737b54
- GUID
- https://medium.com/p/0cd69dff8334
- URL
- https://medium.com/@researchgraph/unveiling-research-trends-through-openalex-visualization-0cd69dff8334
Dates
- Issued
-
2024-03-12T04:52:57
- Updated
-
2024-03-12T04:52:57
References
- Tonmoy, S. M. T. I., Zaman, S. M. M., Jain, V., Rani, A., Rawte, V., Chadha, A., & Das, A. (2024). A Comprehensive Survey of Hallucination Mitigation Techniques in Large Language Models (Version 3). arXiv. https://doi.org/10.48550/arxiv.2401.01313
- Overview | OpenAlex technical documentation. (n.d.). https://docs.openalex.org/
- Nees, J. V. E., & Waltman, L. (2018). VOSViewer Manual. https://www.vosviewer.com/documentation/Manual_VOSviewer_1.6.8.pdf
- Levallois, C., Nees Jan van Eck, & Ludo Waltman. (2017). A tutorial for vosviewer. https://seinecle.github.io/vosviewer-tutorials/generated-pdf/importing-en.pdf
- OurResearch. (2023, December 14). Webinar: OpenAlex and VOSViewer: Uniting to enable free, easy, and high-quality research analytics [Video]. YouTube. https://www.youtube.com/watch?v=MfwFzLQmUwo