
Weekly Recap (Feb 2025, part 1)
Creators & Contributors
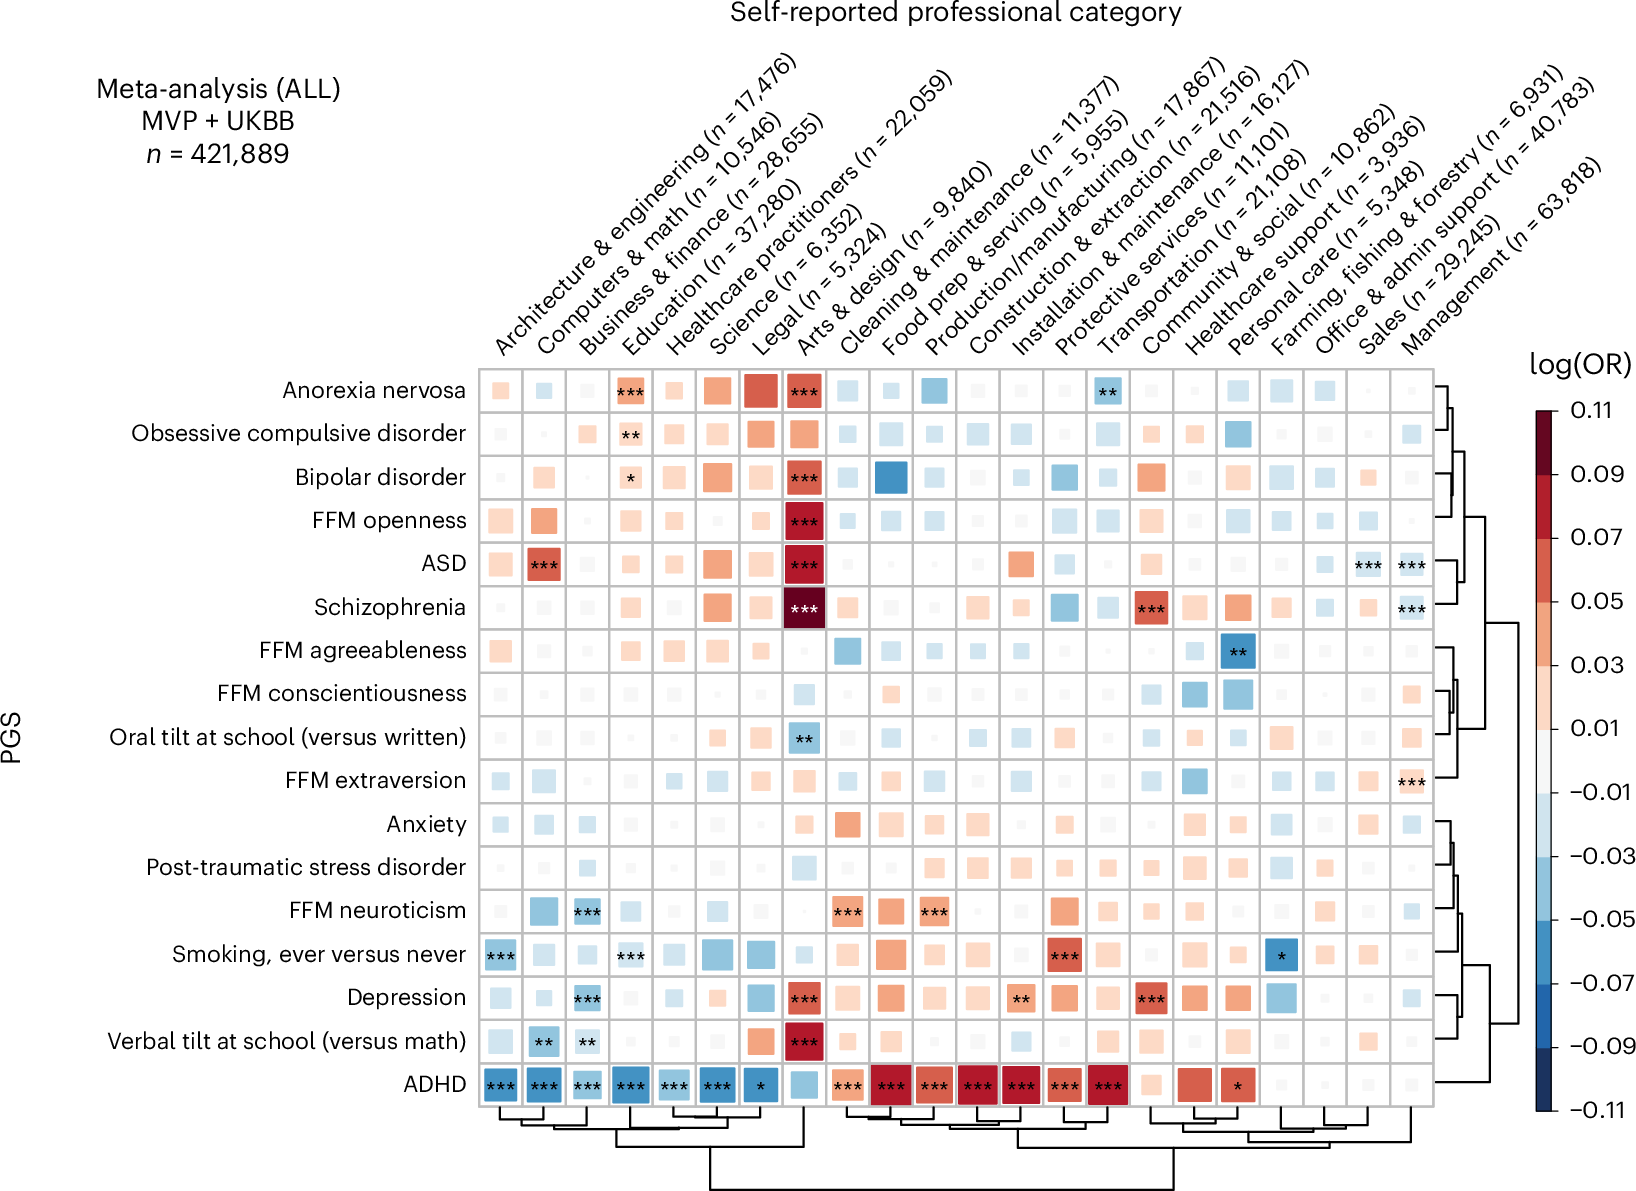
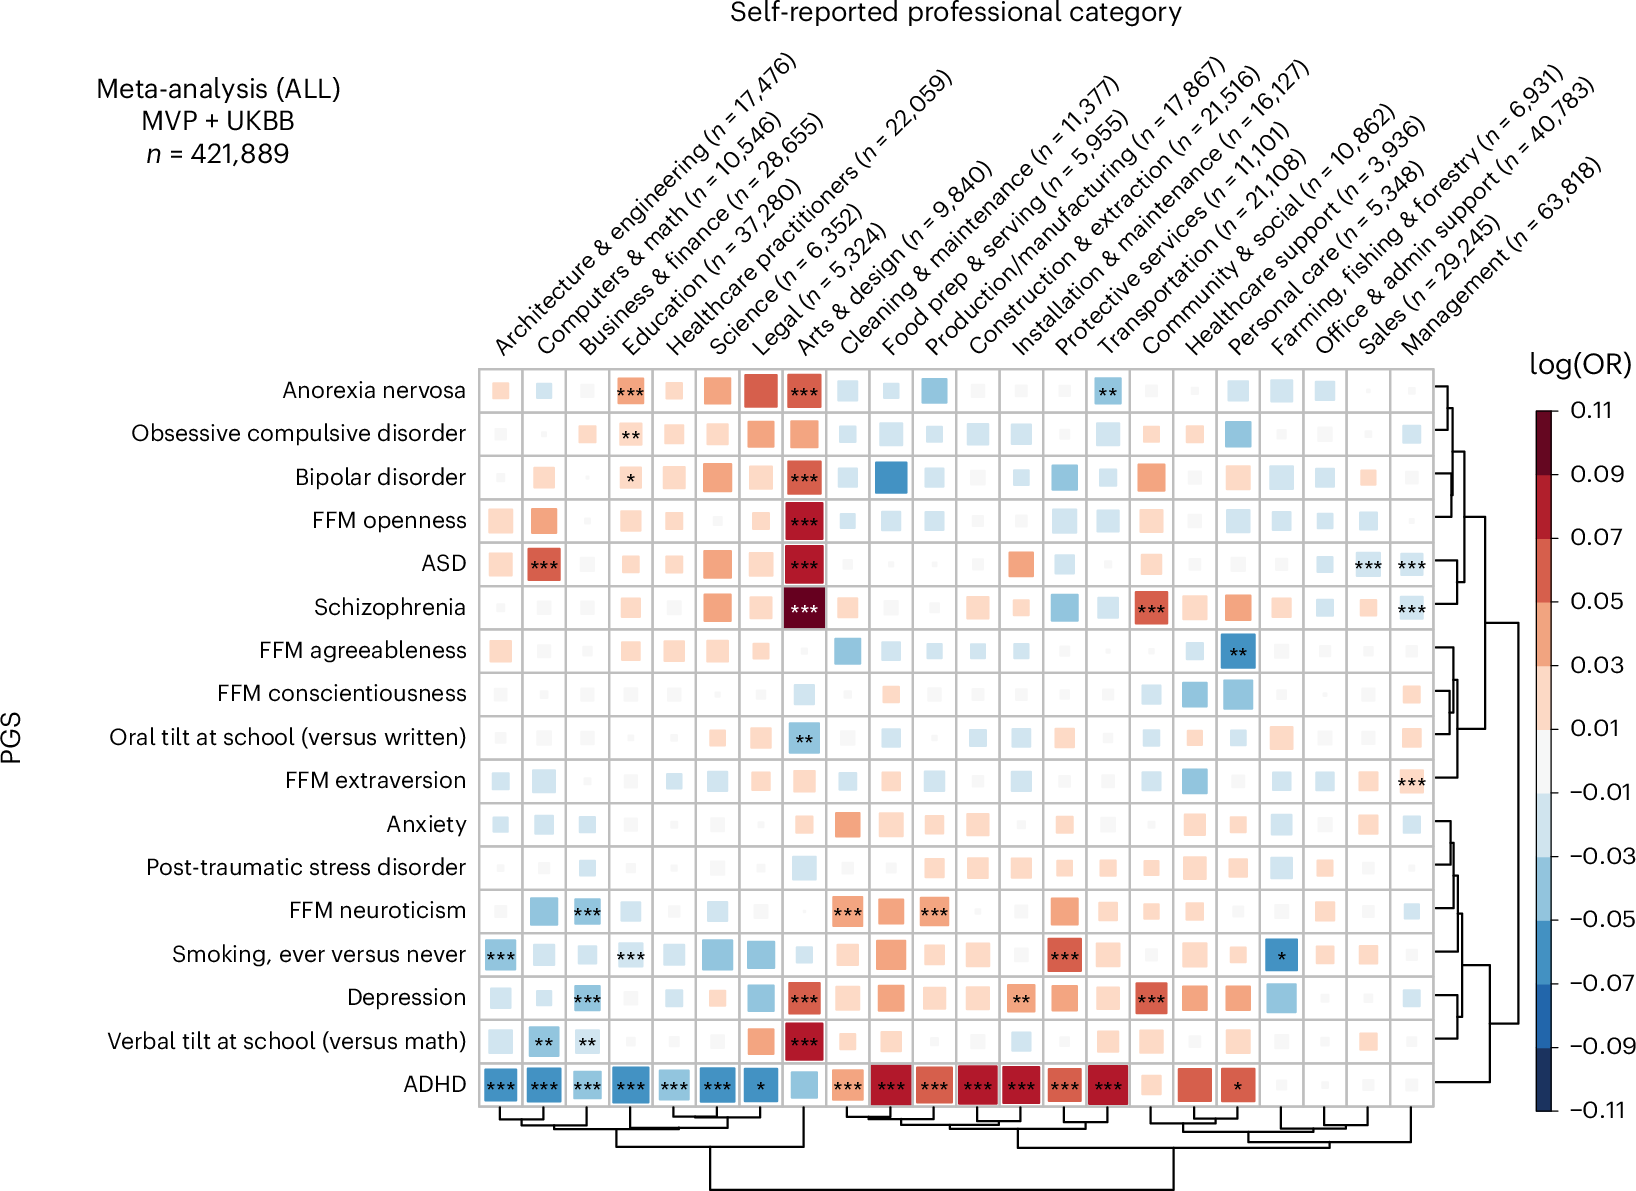
We're 6 weeks into the new year and I'm still catching up on papers from my late 2024 backlog. This week's recap highlights a study demonstrating that neuropsychiatric polygenic scores are weak predictors of professional categories, Gfa2bin for converting genome graphs to pan-genomic genotypes for graph-based GWAS, considerations for building and using integrated single-cell atlases, sketching in genomic epidemiology, and a multimodal foundation model for protein phenotypes.
Others that caught my attention include methods for identifying transition cells in scRNA-seq data, a cross species single-cell analysis revealing divergence and conservation of peripheral blood mononuclear cells, a new Nextflow pipeline for taxonomic classification and functional annotation of metagenomics data, network analysis for characterizing genetic architecture and trait-specific biology, precision filtering of RNA databases to curate high-quality datasets, modeling and predicting single-cell multi-gene perturbation responses with scLAMBDA, and quantifying the impact of spatial proximity on cell phenotype with SpatioMark.
Deep dive
Neuropsychiatric polygenic scores are weak predictors of professional categories
Paper: Voloudakis, G., et al., "Neuropsychiatric polygenic scores are weak predictors of professional categories," Nature Human Behaviour, 2024. https://doi.org/10.1038/s41562-024-02074-5.
In a former life I spent some time reporting to a client all the current literature demonstrating how neuropsychiatric polygenic risk scores can (or more likely cannot) be used to predict at an individual level extraordinarily complex "traits" like life outcomes, career choices, etc. It'll be interesting to see how research like that in this paper lands in the community of startups and users of polygenic embryo selection.
TL;DR: This study explores how polygenic scores (PGS) for 17 neuropsychiatric traits relate to 22 professional categories in large cohorts, finding statistically significant but weak associations. PGS explains less than 0.5% of variance in professional category membership, with much stronger influences from education and socio-economic factors.
Summary: Polygenic scores, reflecting genetic predispositions to neuropsychiatric traits, are analyzed across two major cohorts to assess their link to professional categories. While some associations are statistically significant, their effect sizes are small, with the strongest associations explaining less than 0.5% of the variance. For example, ADHD PGS was linked to 15 professional categories, often mediated by educational attainment. The strongest relationship was between schizophrenia PGS and the "arts & design" category. Variance partitioning showed demographic factors like age and education contributed far more to professional category membership. These results highlight the limited predictive power of PGS in complex social phenotypes and the interplay of genetic and environmental factors.
Methodological highlights:
Comprehensive meta-analysis of PGS-professional associations across two cohorts (MVP and UKBB; combined n=421,889).
Adjustments for confounders, including education, socio-economic status (SES), and fluid intelligence, to disentangle genetic effects.
Utilized principal component analysis (PCA) to explore population-level trends and variance partitioning to quantify contributions of genetics versus other factors.
New tools, data, and resources:
Data: The data is available only to researchers affiliated with the Veterans Affairs (VA). Anyone can register for and pay for access to the UKBB data.
Code: The paper makes use of the variancePartition R package, available on GitHub (https://github.com/DiseaseNeuroGenomics/variancePartition/) and Bioconductor.
Gfa2bin enables graph-based GWAS by converting genome graphs to pan-genomic genotypes
Paper: Vorbrugg, S., et al., "Gfa2bin enables graph-based GWAS by converting genome graphs to pan-genomic genotypes," bioRxiv, 2024. https://doi.org/10.1101/2024.12.05.626966.
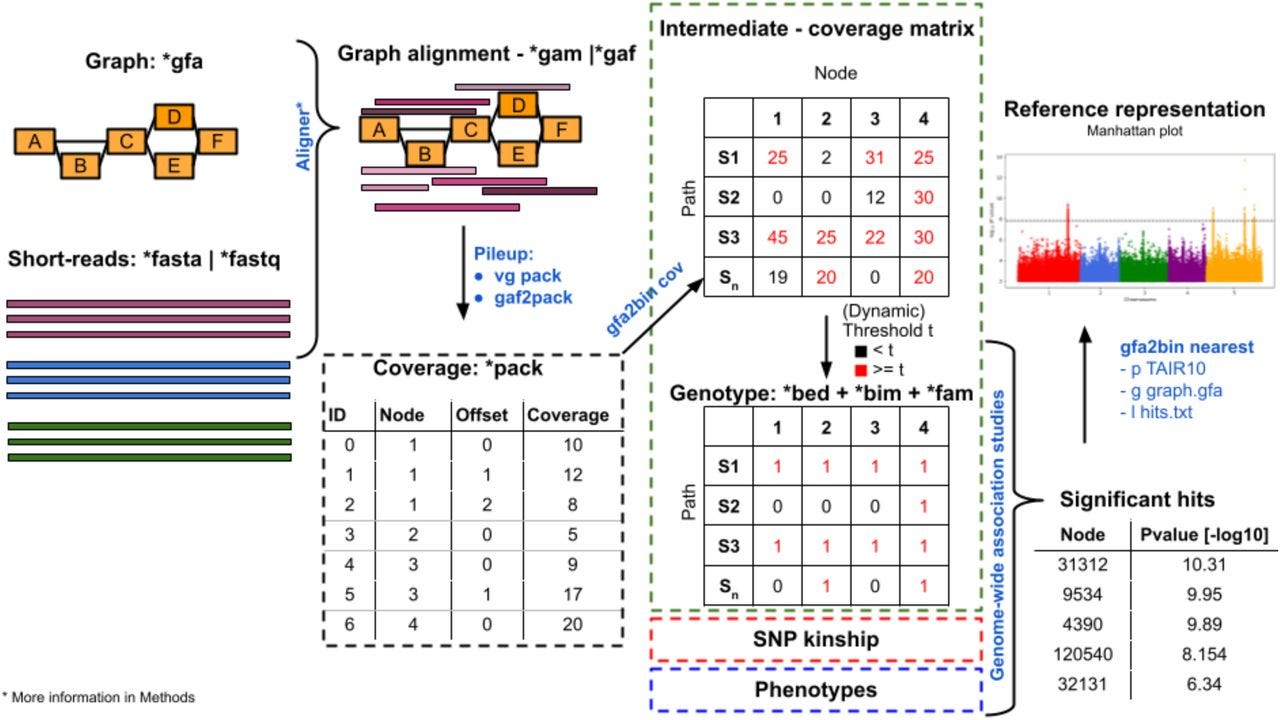
I've written about a lot of pangenome tools in these weekly recaps. This one converts genome graphs from GFA to formats used for GWAS analysis (e.g. PLINK) using a Snakemake workflow.
TL;DR: This paper introduces Gfa2bin, a tool that bridges genome variation graphs with GWAS workflows, enabling more comprehensive analysis of genetic variation and traits. It identifies additional significant associations compared to SNP-based GWAS, offering a new perspective in genomic research.
Summary: Gfa2bin facilitates genome-wide association studies (GWAS) by converting genomic variation graphs into genotype matrices compatible with standard GWAS tools. Unlike traditional SNP-focused approaches, variation graphs capture structural variants and complex alleles, broadening the scope of detectable genetic diversity. Using Arabidopsis thaliana, the authors demonstrated that Gfa2bin-based GWAS identified both unique and shared trait associations compared to SNPs and k-mers, often with higher statistical significance. The study highlights its utility in resolving complex genetic features like structural variants and its compatibility with existing pipelines, supported by a comprehensive Snakemake workflow. This work suggests a promising future for combining graph-based and traditional methods to enhance genetic discovery.
Methodological highlights:
Converts genome variation graphs in GFA format to GWAS-ready genotypes in PLINK and BIMBAM formats.
Supports integration with GWAS pipelines using tools like GEMMA, enabling advanced analyses of structural variants and multi-allelic traits.
Implemented in a Snakemake workflow.
New tools, data, and resources:
Gfa2bin: Tool for converting genome graphs to GWAS-compatible genotypes. Repository: https://github.com/MoinSebi/gfa2bin.
Packing Tool: Efficient preprocessing of sequence-to-graph alignments for storage and coverage normalization. Repository: https://github.com/MoinSebi/packing.
Considerations for building and using integrated single-cell atlases
Paper: Hrovatin, K., et al., "Considerations for building and using integrated single-cell atlases," Nature Methods, 2024. https://doi.org/10.1038/s41592-024-02532-y. (Read free: https://rdcu.be/d4jXy).
Before getting to this paper, ICYMI Abhishaike Mahajan (Owl Posting) has a really good primer on scRNA-seq foundation models that's definitely worth a read. As part of the setup he has a section on cell atlases and why they're important:
So, we now know what scRNA-seq is. What have people done with it? Lots of things, such as analyzing transcriptional changes that occur as we age, understanding cell differentiation in embryos, and even understanding how tumor cells could be better attacked.
But, amongst the most ambitious tasks that scRNA-seq is supporting is in the creation of 'Cell Atlases'. These are terabyte-sized databases, ran by international consortia, with hundreds of institutions and thousands of scientists participating. Contained with them are the transcriptional landscapes of hundreds of thousands of individual cells, selected from an extraordinarily diverse set of tissues (tongue, cerebellum, ovaries, and dozens more), cataloged for public usage. As of this writing, there are comprehensive cell atlases for humans, mice, nematodes, primates, zebrafish, fruit flys, and many more; many of them overlapping in scope, and some of them even mapping fetal or diseased versions of the associated species.
Now, to this paper, which talks about building and using them.
TL;DR: This review provides a comprehensive roadmap for building and utilizing integrated single-cell atlases, emphasizing best practices for data integration, metadata harmonization, and broad accessibility to drive consensus and innovation in single-cell research.
Summary: Integrated single-cell atlases combine diverse datasets to provide a high-resolution reference for understanding cellular heterogeneity and its variation across conditions. This paper reviews the critical steps of atlas construction, from defining its focus and selecting datasets to integrating data and sharing the resource. Key challenges such as harmonizing metadata, removing batch effects, and balancing biological variation are addressed. The paper also highlights how atlases enhance discovery through improved cell-type annotations, novel gene function insights, and guidance for experimental designs. As living resources, these atlases can evolve with new data and technologies, with implications for biomedical research, personalized medicine, and cross-species comparisons.
Methodological highlights:
Establishes workflows for batch effect removal and gene selection during data integration while maintaining biological variation.
Proposes strategies for scalable reference mapping and dynamic updates to incorporate new datasets and omics modalities.
Introduces metrics for atlas evaluation, emphasizing biological preservation and the removal of residual technical artifacts.
New tools, data, and resources:
Code: The code for the analysis of the published scRNA-seq datasets depicted in Fig. 1 is available at https://github.com/lueckenlab/single-cell-papers-trends/.
Data: The final results of the analysis of the published scRNA-seq datasets are collected in Supplementary Table 2 and the intermediate results are available at https://github.com/lueckenlab/single-cell-papers-trends/.

Mashpit: sketching out genomic epidemiology
Paper: Xu, T., et al., "Mashpit: sketching out genomic epidemiology," Journal of Open Source Software, 2024. https://doi.org/10.21105/joss.07306.
If I had to create a reading list of important 21st century papers in bioinformatics, the original Mash paper by Brian Ondov, Todd Treangen, Páll Melsted, Adam Mallonee, Nick Bergman, Sergey Koren, and Adam Phillippy would be on this list. (I'm not the only one — Jim Shaw, the developer of sylph, wrote this excellent blog post back in November of last year about how Sylph was developed, starting the blog post with Mash being the first bioinformatics paper he read). Since Mash came out, dozens of derivatives, improvements, and new applications of MinHash sketches and related data structures have been published.
TL;DR: Mashpit is a lightweight genomic epidemiology tool for querying massive pathogen genome datasets locally using MinHash algorithms, offering rapid, offline analyses with reduced computational resource requirements. It's great for smaller labs managing sensitive genomic data.
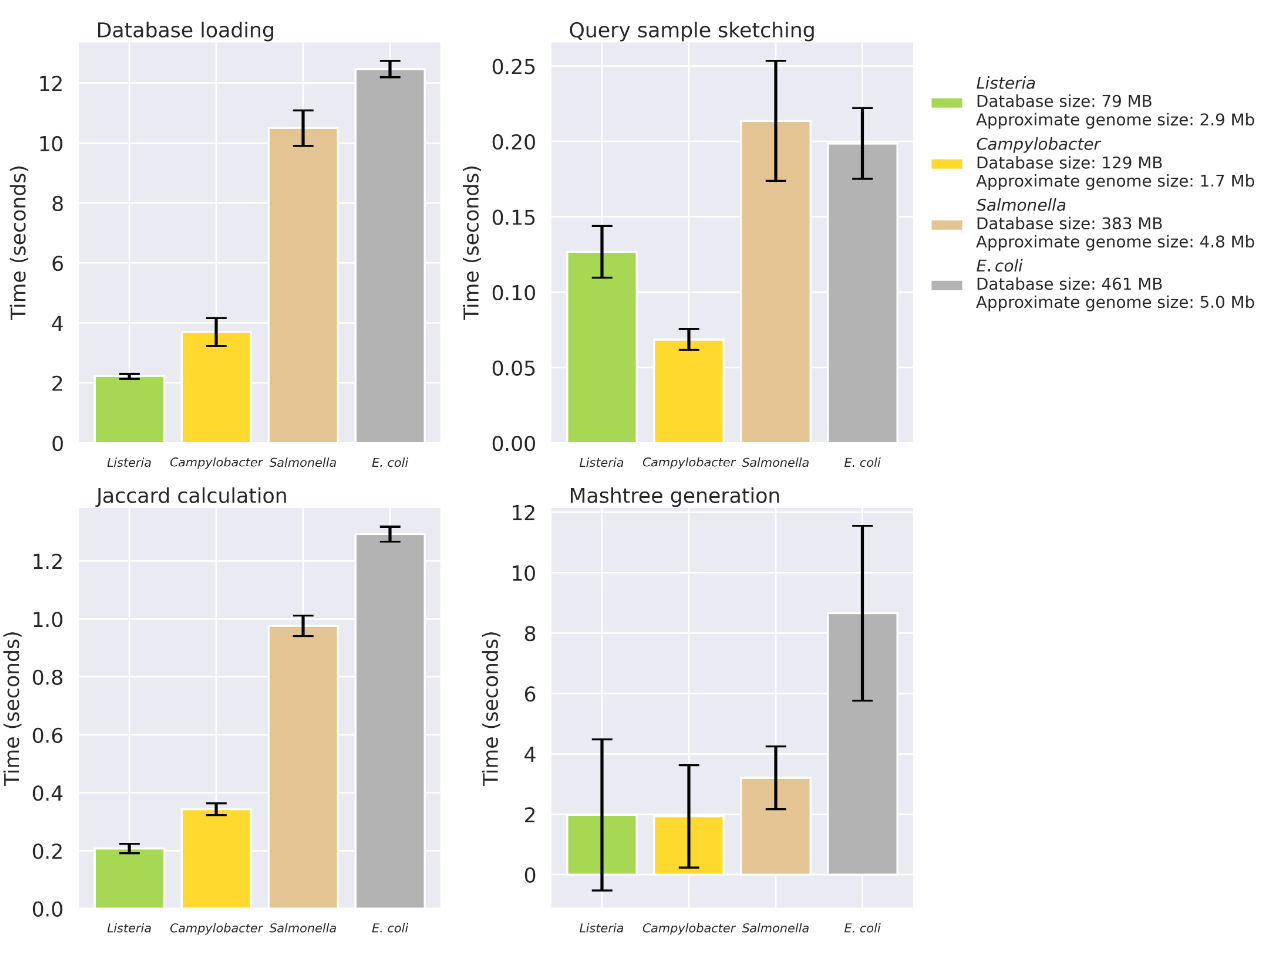
Summary: Mashpit addresses the challenges of genomic epidemiology by providing a local, efficient platform for analyzing pathogen genomes using MinHash-based methods. It creates and queries species-specific databases, allowing offline analysis of sensitive data without requiring high-end computational infrastructure. While capable of handling massive datasets, such as the 600,000+ Salmonella genomes at NCBI, Mashpit performs well on standard scientific workstations, making it accessible to smaller labs. However, due to its reliance on MinHash, its resolution for closely related genomes is limited, suggesting it serves best as a preliminary tool before applying higher-resolution methods like MLST.
Methodological highlights:
Implements MinHash-based genome sketching and querying via Sourmash, optimizing speed and storage.
Creates species-specific databases using centroid genome selection to reduce redundancy while retaining representative data.
Includes a webserver interface for user-friendly local or deployed querying.
Sourmash integration: Underpins the genome sketching and querying process, facilitating streamlined workflows.
Supports querying large datasets like those in NCBI Pathogen Detection for Salmonella, E. coli, and other pathogens.
New tools, data, and resources:
Code: Available at https://github.com/tongzhouxu/mashpit. Written in Python, GPL-2.0 license.
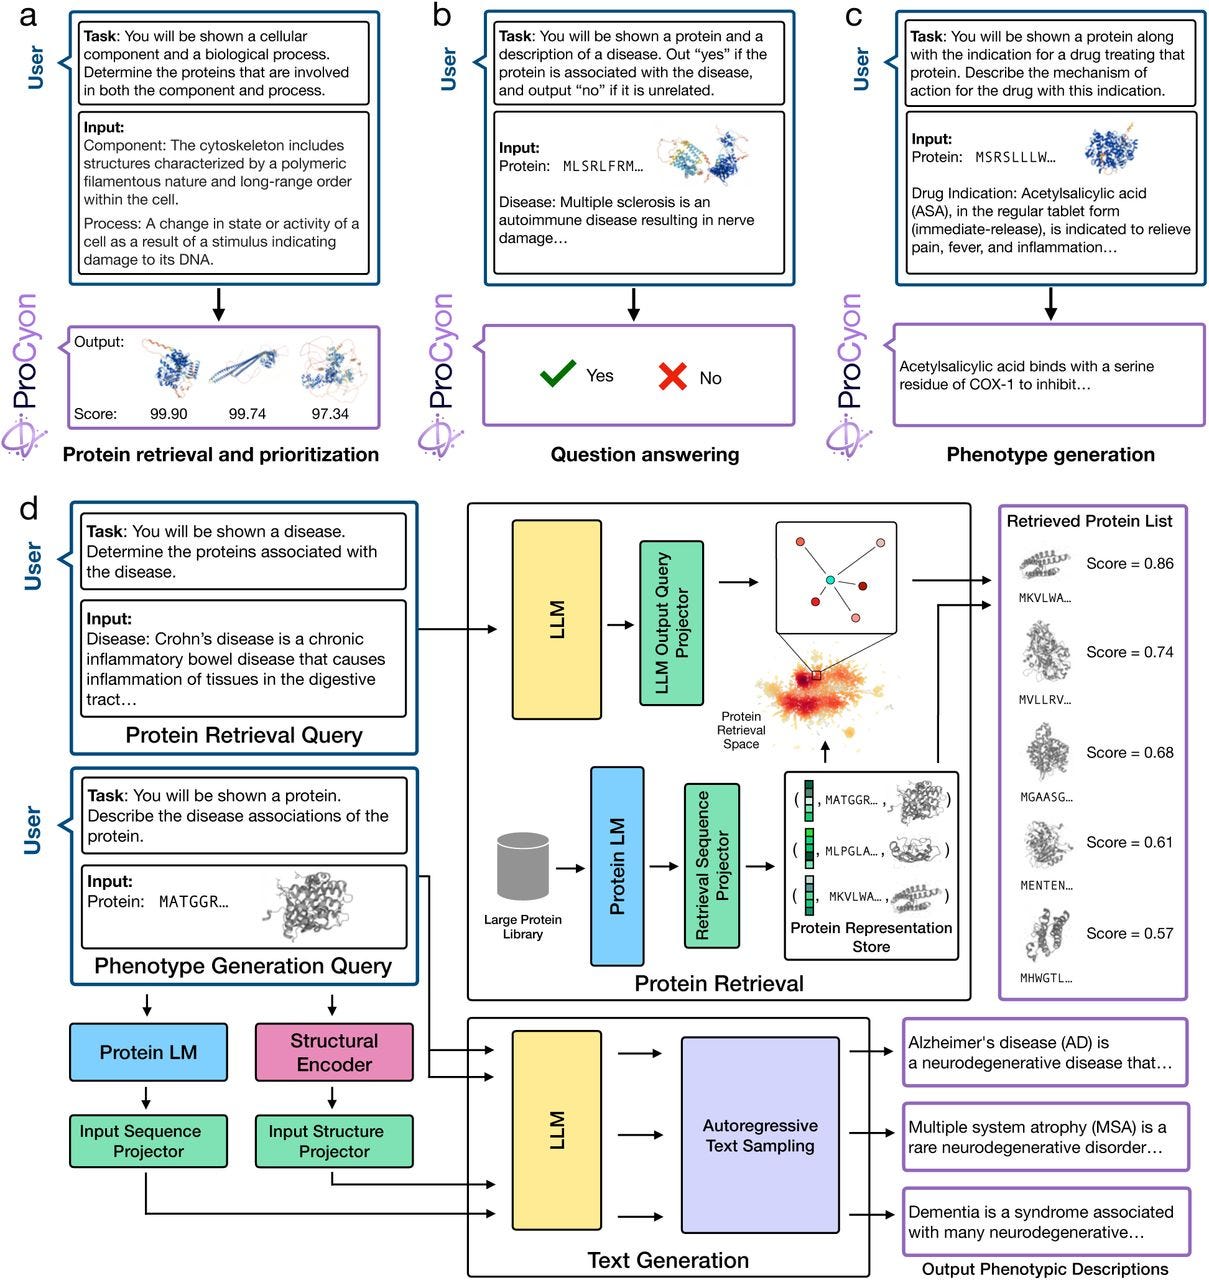
ProCyon: A multimodal foundation model for protein phenotypes
Paper: Queen, O., et al., "PROCYON: A multimodal foundation model for protein phenotypes," bioRxiv, 2024. https://doi.org/10.1101/2024.12.10.627665.
Tools like AlphaFold 2/3 and ESMFold help with predictin gatomic protein structure, but they don't predict protein phenotypes. Protein language models can capture function through learned embeddings but don't have the explicit modeling needed to link proteins to phenotypes. Multimodal models try to integrate proteins and phenotype data to expand the scope of protein phenotype prediction. Enter ProCyon.
TL;DR: ProCyon introduces a multimodal foundation model that integrates protein sequences, structures, and phenotype data, enabling zero-shot predictions and context-specific protein phenotype descriptions. It's a major leap in exploring and understanding protein function across diverse biological contexts.
Summary: Decoding protein phenotypes is critical for bridging molecular biology with therapeutic and disease insights, yet many proteins remain poorly understood. ProCyon leverages a novel multimodal approach, incorporating protein sequences, structures, and phenotypic descriptions into a unified framework. By training on over 33 million protein-phenotype instructions (ProCyon-instruct dataset), the model outperforms state-of-the-art tools in protein retrieval, question answering, and phenotype generation tasks. It excels in zero-shot settings, enabling novel applications like drug-protein interaction discovery and contextual analysis of genetic variants. ProCyon flexibility and multimodal integration offer unprecedented capabilities for hypothesis generation and functional characterization of unstudied proteins, including those implicated in diseases like Parkinson's and Alzheimer's.
Methodological highlights:
Integrates protein sequence, structure, and phenotypic data into a single latent space using a novel instruction-tuned multimodal architecture.
Enables zero-shot task transfer for novel phenotypes, leveraging natural language prompts for intuitive task definition.
Outperforms both single-modality and multimodal models across benchmarking tasks with substantial accuracy improvements.
New tools, data, and resources:
ProCyon: Multimodal foundation model available at https://github.com/mims-harvard/ProCyon. MIT license.
See also the ProCyon homepage: https://zitniklab.hms.harvard.edu/ProCyon/.
ProCyon-Instruct Dataset: A curated multimodal dataset of protein-phenotype pairs spanning molecular to organismal scales. Accessible at https://huggingface.co/datasets/mims-harvard/ProCyon-Instruct.
Other papers of note
A statistical approach for systematic identification of transition cells from scRNA-seq data https://www.cell.com/cell-reports-methods/fulltext/S2667-2375(24)00303-5
Cross-species single-cell analysis reveals divergence and conservation of peripheral blood mononuclear cells https://bmcgenomics.biomedcentral.com/articles/10.1186/s12864-024-11030-6
EURYALE: A versatile Nextflow pipeline for taxonomic classification and functional annotation of metagenomics data https://ieeexplore.ieee.org/document/10702116
Genomic network analysis characterizes genetic architecture and identifies trait-specific biology https://www.medrxiv.org/content/10.1101/2024.12.03.24318432v1
NucleoSeeker - Precision filtering of RNA databases to curate high-quality datasets https://www.biorxiv.org/content/10.1101/2024.12.06.626307v1
Modeling and predicting single-cell multi-gene perturbation responses with scLAMBDA https://www.biorxiv.org/content/10.1101/2024.12.04.626878v1
SpatioMark: Quantifying the impact of spatial proximity on cell phenotype https://www.biorxiv.org/content/10.1101/2024.12.04.626887v1
Additional details
Description
Neuropsychiatric PGS don't predict professional categories, pangenome graph-based GWAS, building and using single cell atlases, sketching sketching in genomic epidemiology, multimodal protein model...
Identifiers
- GUID
- 153409022
- URL
- https://blog.stephenturner.us/p/weekly-recap-feb-2025-part-1
Dates
- Issued
-
2025-02-07T11:21:34
- Updated
-
2025-02-07T11:21:34