
Experiment and Calculation in WWMM-NMR. Open Notebook Science
Creators & Contributors

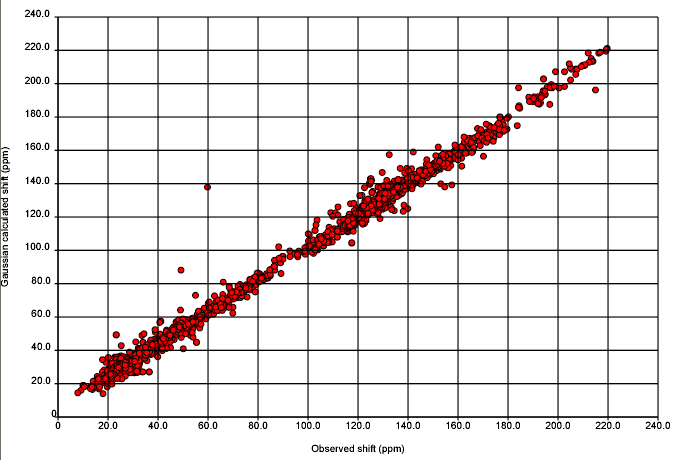
Antony guessed the graph – regular readers will recognise the context of previous posts. We are starting an Open Notebook project to determine whether theoretical calculations and experimental observations agree – or rather within what limits. (Earlier this year I talked with Michael Kohlhase about PhysML, where the basis of the language is to assert that observations and predictions do or do not agree and that hypotheses may or may not be disproved). Being a chemist my language may be sloppier – please forgive or correct me.
Anyway here it is. Nick Day has done all the work and deserves all the credit. There are ca 500 structures in this and they are all aggregated and plotted with the same origin.
Before analysing this, it's important to know the methods in detail. Nick will post more.
Experimental: All (?) structures in NMRShiftDB were extracted (ca. 20000). Compounds unsuitable for calculation (e.g. with heavy metals) were excluded. All files were in CMLSpect and contained 3D coordinates (except for H atoms – everyone PLEASE include H atoms), 13C spectral peaks (shift in ppm), labelled with the atom or atoms to which they were assigned. The solvent, field strength(??), temperature (??) were recorded. I am not sure of the metadata (I am writing from home and Nick will fill all this in later).
In general there is no chance of re-running the spectrum or re-analysing the sample, but it may be possible to contact the authors on an occasional basis.
Calculation: We will give the basis set and method later (I don't know whether Henry uses the term GIAO – he has extended the method). The calculation emits the isotropic tensor which is an absolute value (whereas the chemical shift is relative to tetramethyl silane).
I don't know whether we should transform the experimental to be on the same scale as the calculated, but we have done the reverse. The calculated values are substracted from TMS (in the same solvent as reported for the spectrum).
The comparison is then plotted. We do, of course, have plots for each compound as well.
We'll come onto the analysis later, but you may wish to think about possible reasons for disagreement (i.e. points lying off the line). I have over 10 reasons.
Additional details
Description
Antony guessed the graph – regular readers will recognise the context of previous posts. We are starting an Open Notebook project to determine whether theoretical calculations and experimental observations agree – or rather within what limits.
Identifiers
- GUID
- https://blogs.ch.cam.ac.uk/pmr/?p=710
- URL
- https://blogs.ch.cam.ac.uk/pmr/2007/10/22/experiment-and-calculation-in-wwmm-nmr-open-notebook-science/
Dates
- Issued
-
2007-10-22T08:31:00Z
- Updated
-
2007-10-22T08:31:00Z