Setting default ggplot2 colors

This might be a "everyone else already knew about this" thing, but I've finally gotten to a place of understanding about setting default colors scales for ggplot2, so I thought I'd share.
library(tidyverse)
library(ggdist)
library(ggdensity)
library(showtext)

font_add_google("Public Sans", "Public Sans")
showtext_auto()

knitr::knit_hooks$set(crop = knitr::hook_pdfcrop)set.seed(2024)
sample_data <- tibble(
a = rnorm(1000, mean = 0, sd = 1),
b = rnorm(1000, mean = 2, sd = 1)
) |>
mutate(
id = row_number(),
level = case_when(
b < 0 ~ "low",
b > 3 ~ "high",
.default = "mid"
) |>
fct_relevel(
"low", "mid", "high"
)
)My options for setting default color scales look like this:
# not run
options(
  ggplot2.discrete.colour = lapply(
    1:12,
    ggthemes::ptol_pal()
  ),
  ggplot2.discrete.fill = lapply(
    1:12,
    ggthemes::ptol_pal()
  ),
  ggplot2.ordinal.colour = \(...){
    scale_color_viridis_d(
      option = "G",
      direction = -1,
      ...
    )
  },
  ggplot2.ordinal.fill = \(...){
    scale_fill_viridis_d(
      option = "G",
      direction = -1,
      ...
    )
  },
  ggplot2.continuous.colour = \(...){
    scico::scale_color_scico(
      palette = "batlow",
      ...
    )
  },
  ggplot2.continuous.fill = \(...){
    scico::scale_fill_scico(
      palette = "batlow",
      ...
    )
  }
)
Theme setting
I've known for a while now that you can change the default theme of plots with theme_set(), which can actually be more in-depth than just a default theme_*() function.
ggplot(sample_data) +
geom_point(
aes(a,b)
) ->
base_p
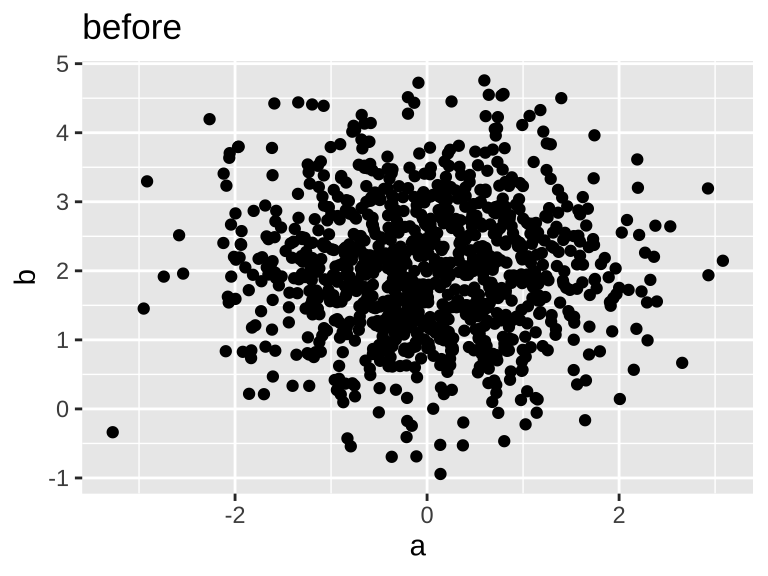
base_p +
labs(title = "before")
### setting the theme
theme_set(
theme_ggdist(base_size = 16) +
theme(
text = element_text(
family = "Public Sans"
)
)
)
base_p +
labs(title = "after")

Setting the default colors
According to the changelogs, as of ggplot2 v3.3.2, the default color and fill scales can be set by passing values to options(). One way is to pass a list of values. I'll use withr::with_options() to demonstrate.
Discrete colors
Without doing anything
Here's how things look by default:
ggplot(
  sample_data
)+
  geom_point(
    aes(
      a,
      b,
      color = level
    )
  ) ->
  discrete3_p

ggplot(
  sample_data
)+
  geom_point(
    aes(
      a,
      b,
      color = a < 0
    )
  ) ->
  discrete2_p
discrete2_p
discrete3_p

Setting the default with a list
If we set the default colors by setting options(ggplot2.discrete.colour = ) a list of color values, ggplot will use those colors if there's enough, and if there's not enough, it'll fall back to the default scale_color_hue().


You could even set a completely different vector of values for 3 colors.


What I set up in my actual _defaults.R files is to generate all of the possible palettes from ggthemes::ptol_pal(), because I like it.

I could set ggplot2.discrete.colour to ggthemes::scale_color_ptol(). But by setting it to the progessively larger list of colors, if if make the decision1 to map a factor with 13 labels to color, instead of erroring or just not plotting some points, it will fall back to the built in scale_color_hue().
Here's an example showing using that 13+ levels example
Setting up base plots
ggplot(sample_data)+
  geom_point(
    aes(
      a,
      b,
      color = cut(a, 10)
    )
  )+
  guides(
    color = "none"
  )->
  base_10_p

ggplot(sample_data)+
  geom_point(
    aes(
      a,
      b,
      color = cut(a, 15)
    )
  )+
  guides(
    color = "none"
  )->
  base_15_p
Plotting code
base_10_p +
  labs(
    title = "10 cuts, list"
  )
base_15_p +
  labs(
    title = "15 cuts, list"
  )
base_10_p +
  ggthemes::scale_color_ptol()+
  labs(
    title = "10 cuts, scale"
  )
base_15_p +
  ggthemes::scale_color_ptol()+
  labs(
    title = "15 cuts, scale"
  )


Error in colors[[n]]: subscript out of bounds
Continuous colors
The continuous color scales need to be set more straightforwardly with a function that returns a scale_color_*(). I'm kind of bouncing around continuous color scales I like, but for now, I'm defaulting to the batlow palette from scico.
Since getting the specific batlow palette requires passing arguments to scico::scale_color_scico(), I need to pass ggplot2.continuous.colour an anonymous function.
ggplot(sample_data)+
  geom_point(
    aes(
      a, b,
      color = a
    )
  )->
continuous_baseoptions(
ggplot2.continuous.colour = \(...){
scico::scale_color_scico(
palette = "batlow",
...
)
},
ggplot2.continuous.fill = \(...){
scico::scale_fill_scico(
palette = "batlow",
...
)
}
)continuous_base
Ordinal colors
For the longest time, I only had settings for continuous and discrete color scales, and I kept getting frustrated when an occasional plot would show up with neither of my options showing up.

I could not, for the life of me, figure out what option I had to set to change the default here! I eventually just searched the ggplot2 github for getOption and found ggplot2.ordinal.colour! This is definitely not documented anywhere in the actual ggplot2 docs!
Anyway, l kind of like the mako viridis palette for this, so that's what I'm using:
options(
  ggplot2.ordinal.colour = \(...){
    scale_color_viridis_d(
      option = "G",
      direction = -1,
      ...
    )
  },
  ggplot2.ordinal.fill = \(...){
    scale_fill_viridis_d(
      option = "G",
      direction = -1,
      ...
    )
  }
)
density_points
When I wind up doing this
For any one-off plot or notebook, I just set change the color scales "manually" in the normal way, by adding a scale_color_*() layer to the plot. But once I start working on a longer document or, say, a course website, I drop these options into a _defaults.R file at the top of my project directory, and source it on every page with
Footnotes
bad↩︎
Reuse
Citation
@online{fruehwald2024,
  author = {Fruehwald, Josef},
  title = {Setting Default Ggplot2 Colors},
  series = {Væl Space},
  date = {2024-10-01},
  url = {https://jofrhwld.github.io/blog/posts/2024/10/2024-10-01_ggplot2-default-colors/},
  doi = {10.59350/819mg-fsc29},
  langid = {en}
}
Additional details
Description
This might be a "everyone else already knew about this" thing, but I've finally gotten to a place of understanding about setting default colors scales for ggplot2, so I thought I'd share.
Identifiers
- UUID
- 823516be-bb1e-4af4-bc4c-1c4a6830f6ef
- GUID
- https://jofrhwld.github.io/blog/posts/2024/10/2024-10-01_ggplot2-default-colors/
- URL
- https://jofrhwld.github.io/blog/posts/2024/10/2024-10-01_ggplot2-default-colors/
Dates
- Issued
-
2024-10-01T02:00:00
- Updated
-
2024-10-01T02:00:00