
What does Anthropic's Latest Economic Index Data Really tell us?
Creators & Contributors
When Anthropic released its Economic Index in January 2026, the Financial Times ran with the provocative headline: "Rich countries' greater use of AI risks deepening inequality, Anthropic warns." It made me want to click. But then it made me do something else.
Anthropic's underlying research report, on which the FT's article was nominally based, doesn't really support such a claim I discovered.
Anthropic's latest research based on its Economic Index has a number of useful and important findings. Anthropic should in general be commended for making this data publicly available. They don't have to do this public service but they choose to.
One claim in their new and wide-ranging research report that I found wanting is the following: "worldwide, uneven [AI] adoption [by countries] remains well-explained by GDP per capita" (i.e. a country's output per person or income-level). The only thing is, their data doesn't support this research claim. But regardless, I don't think much can be inferred from it.
When it comes to analyzing data, if you run a super simple statistical model — in this case treating all countries as being the same — then you will, by definition, only be able to get a super simple answer. (That's how statistical models work!) But if you run an analysis that allows for differences between countries to be explored more seriously, then you allow for more interesting answers to emerge on what explains differences between countries' AI adoption.

That is what I try to show below: GDP per capita explains relatively little of the variation in Claude.ai usage between countries, it's unclear what this relationship even implies, and that this certainty cannot be used to predict growing inequality between countries from AI adoption (even if that is the future we should be concerned about).
The full analysis can be found on my GitHub. (And yes — we could have made the analysis a bit more sophisticated with a Bayesian multilevel / hierarchical model, but the partial pooling was very strong.)
What Anthropic's Data Actually Measures
Interpretation matters. Anthropic is looking at AI adoption across countries. It does so using usage of Claude.ai by consumers.
This matters for three reasons. Firstly, Claude is not the whole AI market. Lower Claude usage in a country may simply reflect people using ChatGPT or local tools more instead. This is especially important since ChatGPT is the dominant consumer-facing AI product outside of China.
Secondly, the country-level data comes primarily from Claude.ai, a consumer-facing product. And if you are concerned about how AI adoption is impacting a country's productivity or growth, you would instead want to see what is happening in firms and their workflows — where API use and enterprise deployments are dominant.
Claude consumer usage is not a strong proxy for "AI is transforming the economy here." Anthropic's own data shows that on the API (enterprise) usage, 74% of usage is work-related, while on Claude.ai (consumer), only 46% is work-related. (Of course consumer-use can impact economy-wide productivity, but economists believe that the firm's fixed capital investment is the primary channel through which new innovations enter the economy.)
Thirdly, Anthropic's Claude usage is a relative measure: how much one country uses Claude relative to another on a normalized scale. This doesn't tell us much about if this usage is economically or societally meaningful.
The Heroic Leap to "Living Standards"
The Financial Times (FT) coverage of Anthropic's research actually didn't cover much of it at all when it declared: "Rich countries' greater use of AI risks deepening inequality, Anthropic warns." This relies largely on an altogether reasonable quote from Anthropic's head of Economics, Peter McCrory, discussing future risks from AI adoption. (It also might be based on a scatter plot the FT reproduce showing great use of Claude for homework in poorer economies and personal use in richer economies. But I don't understand the connection between this and AI accelerating inequality between countries.)
To the FT's credit, they contacted me when I alerted them to the fact that their article's headline was not based on much. Anthropic's research report does not estimate country-level productivity or growth effects resulting from AI adoption. It does not estimate impacts on wages, output, or investment. It does not model diffusion or spillovers. So the claim that AI adoption patterns imply future divergence in living standards between countries is, at best, a hypothesis in search of evidence.
On to Anthropic's research claim that I want to interrogate more closely: that a country's income level (GDP per capita) predicts its degree of AI adoption — or really relative Claude consumption by consumers (on a working age per capita basis).
Does a Country's Income Level Drive AI Adoption, as Anthropic Claims?
Anthropic's research reports a strong global relationship between GDP per capita and Claude usage: roughly, a 1% increase in GDP per capita (x) is associated with a 0.7% increase in usage (y), according to their regression analysis (Beta coefficient, B=0.7).
TL;DR: Regression is a fancy way of saying does variation in 'x' (income level) predict or explain variation in 'y' (Claude AI adoption).
The above approach, of estimating a single relationship applicable to all countries between x and y, assumes that the impact of a country's income level on their AI adoption is the same for every country no matter their culture, supporting technological infrastructure, starting level of development, or related government policies.
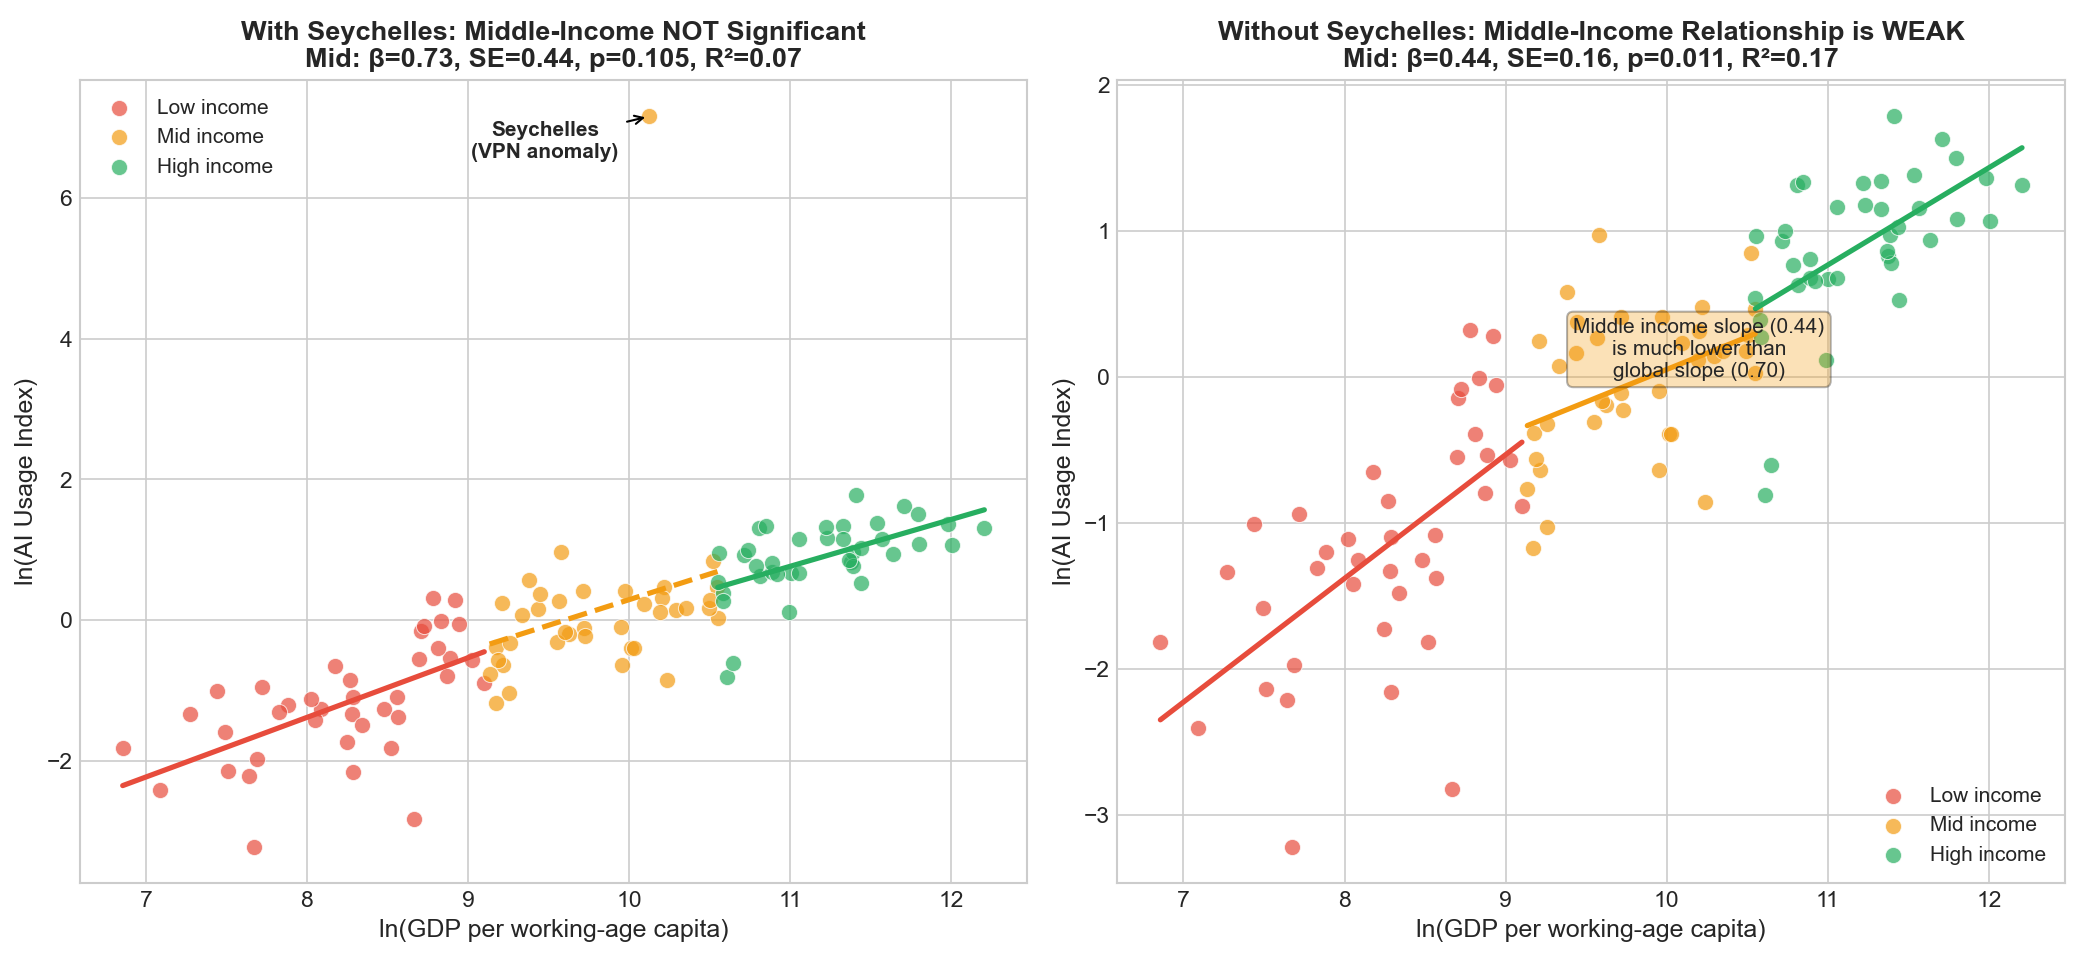
Instead of fitting a single line to the data, I decided to fit three separate lines, for three separate regressions, one per income band (low, middle, high): shown in the Figure below — the red, orange, and green lines (it looks nicer on the GitHub).
Why three separate regression lines? This is done on the speculative hypothesis that a country's level of development (its GDP per capita) may impact Claude usage differently, depending on their starting point — or any group-level peculiarities (differences) that are not strongly captured by differences between their level of development alone.
When we split the sample into three equal income groups (low, middle, high), I find that the estimated relationship between income level (GDP per capita) and AI Adoption weakens across all three country income groups — but for middle-income countries (38 of them) it largely evaporates.
Figure 1 shows the same relationship Anthropic estimates, but now separately for each income group — and importantly with and without the Seychelles included in the sample (left hand side vs. right hand graph). The Seychelles country circle is almost off the graph (left hand side). It's a glaring outlier, where the Claude usage index is many times larger than any peer and is plausibly dominated by VPN / proxy traffic.
When removing this large outlier (as Anthropic should have done), GDP per capita now explains only about 17% of the variation in Claude usage among middle-income countries. That's not a ton of explanatory power but it's actually not bad given that they reduce all AI adoption differences to this single factor. This also means that GDP per capita probably captures a bunch of things that should ideally be estimated separately — things like education level, IT infrastructure, industry composition, and availability of competitive alternatives. (Since these things might vary by country and not be perfectly correlated with GDP per capita.) As they say in Futurama: "Don't try this, kids at home"!

The GDP per capita slope coefficient from this middle-income country regression (reflecting how x impacts y) is 0.44, far below Anthropic's single global pooled estimate of 0.71. This estimate of 0.44 is basically the same one I got when I reran this analysis on their dataset from a few months back. So it's pretty stable (even though the regression residuals change in their direction).
Table 1. Comparing Anthropic's Global (pooled) regression results with fitted separate regression lines for each country group — with and without Seychelles outlier.
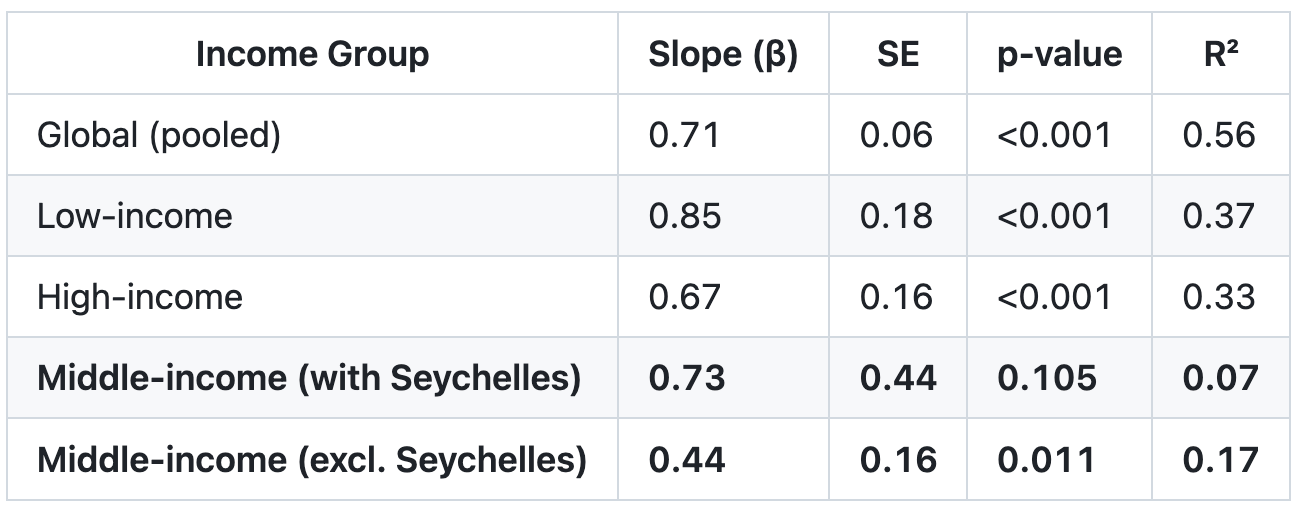
In plain terms: for the 37 middle-income countries where much of the global population lives, income level is a weak predictor of relative Claude usage. Practically, it could mean that things like education, connectivity, language access, business structure, regulation may matter more than income level in explaining differences in AI adoption between these countries (to the extent that these are not correlated with income level differences). Or it could simply mean that ChatGPT is more popular than Claude in some of these countries for whatever reason — and that this competitive alternative explains why some middle-income countries use Claude less than others, compared to what their income level would predict.
If you Care about Global Divergences, You Should Look at Growth (changes over time)
Anthropic's research also finds that concentration across countries in AI usage is "essentially unchanged" between its August and November 2025 data releases, citing a Gini statistic they calculate. I'm not so sure about this. Concentration measures like the Gini can look stable in short windows even when growth rates differ in a way that compounds over time.
So instead I looked simply at median growth rates in Claude AI adoption between two time periods for each of these three income groups (Table below). This shows that middle-income countries have the slowest growth in AI adoption (+14%) between periods — even though more of them numerically saw increased adoption relative to low income countries. High income countries show the fastest median growth in AI adoption (+26%) and low income countries are in between the two (22%).
Table 2. Change in AI adoption between August and November 2025 (Seychelles excluded)
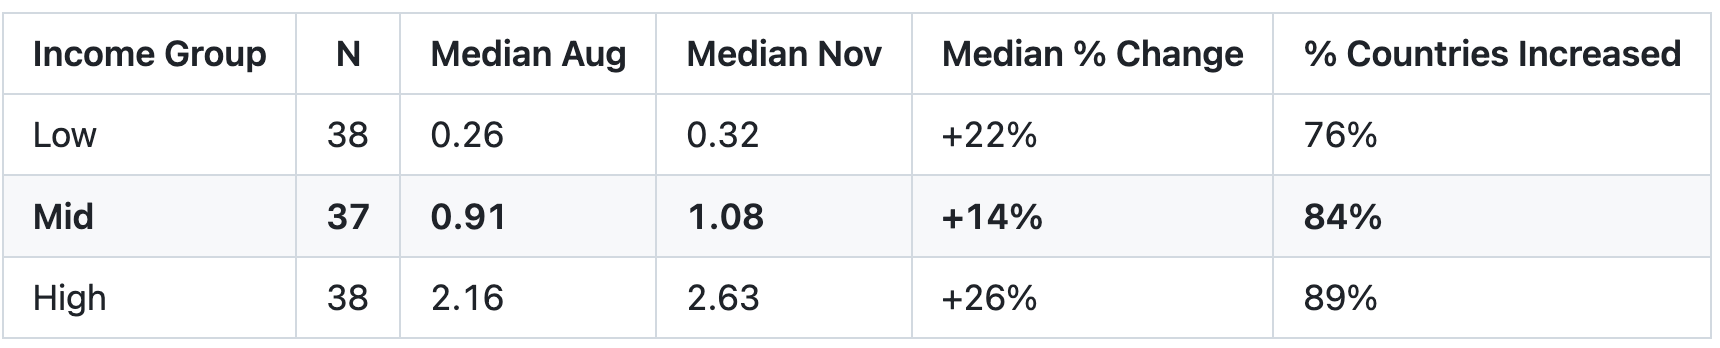
This is by no means conclusive. It's just a median country-level value. But either way, when investigating divergences, growth rates that use multiple data points per country need to be looked at, since these capture measured changes over time. This is where the next iteration of Anthropic's economics research on this question might lie.
What Can We Say Then? Carefully this time
Anthropic's Economic Index is a valuable contribution. It offers transparency where the industry often offers little and for this they should be commended. But it remains a very partial measure. It should not be treated as a proxy for global AI adoption — still less as evidence about future inequality in economic outcomes, as the Financial Times' headline implies.
Lastly, I must mention that I used Claude Code in my analysis. What's amazing is that myself and Anthropic's economics team both presumably used Claude Code and applied it to the exact same dataset. Yet we seem to have arrived at very different conclusions. This only goes to show that AI agents really are tools. The prior views of the human managing the AI agent may bleed into the analysis conducted by the AI agent, especially when those priors are strongly held. Moreover, this is not a bad thing. Taste matters, especially when there are so many different ways to tackle the same problem.
My own prior is a strong suspicion of pooled regressions that ignore differences between data points (in this case countries).1 Reading a Financial Times article based on the assumption that there are differences between countries further fuels my bias that differences between countries should be the default estimation in cross-country regressions — and econometrics in general. I hope Anthropic's future economics research agrees with me.
For data, full analysis, and work files visit my GitHub:
You can allow for differences to be estimated in the regression and then can assess if those differences matter. But why assume no differences between groups when what you should be trying to estimate are these very differences i.e. heterogeneity?
Additional details
Description
"if you listen very hard, the tune will come to you at last"
Identifiers
- GUID
- 185000336
- URL
- https://asimovaddendum.substack.com/p/what-does-anthropics-latest-economic
Dates
- Issued
-
2026-01-21T14:02:03
- Updated
-
2026-01-21T14:02:03