Local baryons in simulations and reality


Our cosmology du jour, LCDM, suffers a local missing baryon problem: we don’t detect all of the baryons we expected to find associated with the dark matter halos of individual galaxies. Should we?
Empirically, yes. The stars and cold (atomic and molecular) gas appear to be all that there is to see in late type galaxies. Having additional large reservoirs of baryons results in a fine-tuning problem: the amount of extra stuff must vary precisely with galaxy mass so as not to impact the remarkably tight mass-rotation speed relation.
In theory, no. There are lots of places to stash extra baryons in phases where they are hard to detect. Warm/hot ionized gas in the circum-galactic medium (CGM) is one obvious place to harbor hard-to-detect phase of baryonic material that might add up to a lot of mass. Indeed, in many galaxy formation simulations, lots of mass winds up in the CGM. So what should we expect in LCDM?
That depends on who you ask. I went down a deep rabbit hole about this, both covering many different types of modern hydrodynamical simulations and how what we’ve expected has varied historically. It is a mess. But there are consistent threads: we do expect that galaxies might harbor extensive CGM (for reasons that vary) or that the missing baryons might not be in galaxies at all, having been ejected to the intergalactic medium (IGM) or prevented from accreting in the first place.
Rather than attempt a systematic survey of simulations, I’ll focus here on one example, EAGLE. The reason for this choice is that Mitchell & Schaye (2022) address exactly this subject. Here is their Fig. 1, which shows the baryon content of various components as a function of dark halo mass in the top panel. The bottom panel tracks where the heavy elements are, which is interesting, but I won’t address that here.

There’s a lot going on here! For reference, our Milky Way resides in a ~1012 M☉ halo. Above M200 > 1013 M☉, most objects are groups and clusters where the distinction between centrals and satellites starts to matter. It’s complicated enough without that, so I’ll stick to individual galaxies. On the lower mass end, there’s a huge compression of the large range in stellar mass exhibited by dwarf galaxies into a relatively narrow range of halo mass, so the lower limit of M200 = 1010 M☉ captures many but not all dwarf galaxies.
That’s just the x-axis. The y-axis of the top panel shows the fraction of baryons in each component relative to the amount available in each halo (the product of the cosmic baryon fraction and the halo mass). The colored lines denote five different baryonic mass components. We readily observe two: the stars (black line) and cold gas (green line, denoted ISM in the figure legend). Additional components include gas in the CGM (cyan line) and gas that has been ejected to the IGM (red line) or was never accreted in the first place (blue line).
From this perspective, it seems hopeless to account for all the baryons on a halo-by-halo basis. Large galaxies (1011 < M200 < 1013 M☉) eject most of their baryons (the red line exceeds all others). Lower mass galaxies also eject a lot of baryons, but most of them never get accreted in the first place (the blue line). There are a couple of reasons why accretion might be precluded. One is cosmic reionization: heating of the gas in the early universe by the first UV sources makes the gas too hot to stick to low mass halos: its thermal velocity exceeds their escape speed*. Another is feedback, in which the stars that do form in a galaxy return enough energy to the surrounding gas heat it up enough to prevent it from accreting. The latter process apparently dominates in the EAGLE simulations but which effect really dominates is a topic that simulators love to debate.
The largest reservoir of baryons that sticks to its dark matter halos is the CGM. This exceeds both stars and cold (ISM) gas for all halo masses. The CGM mass fraction increases with mass, which appears to be the opposite of what we need empirically, but really we need to sum up all three of the non-observed components to compare with the unseen baryonic mass that we infer:

That seems unlikely to add up, but it isn’t really possible to check. We don’t measure the missing component (by definition); we only infer its existence from the cosmic baryon fraction. One could laboriously check each simulation to see if the various missing components that should not be detected add up in the right way to explain the data, but one could always wave away any inconsistency by tweaking how many baryons get lost to the IGM. Between ejection to the IGM, prevention of accretion in the first place, and a quasi-undetectable CGM, the prospects for rigorously testing simulations are limited. However, each of these are distinct effects that occur in combination. This exacerbates the fine-tuning problem: not only does the unaccounted-for mass have to vary just so, these different mechanisms must somehow conspire to makes it so. It does not inspire confidence that this will work out when one realizes that these different mechanisms behave differently in different simulations.
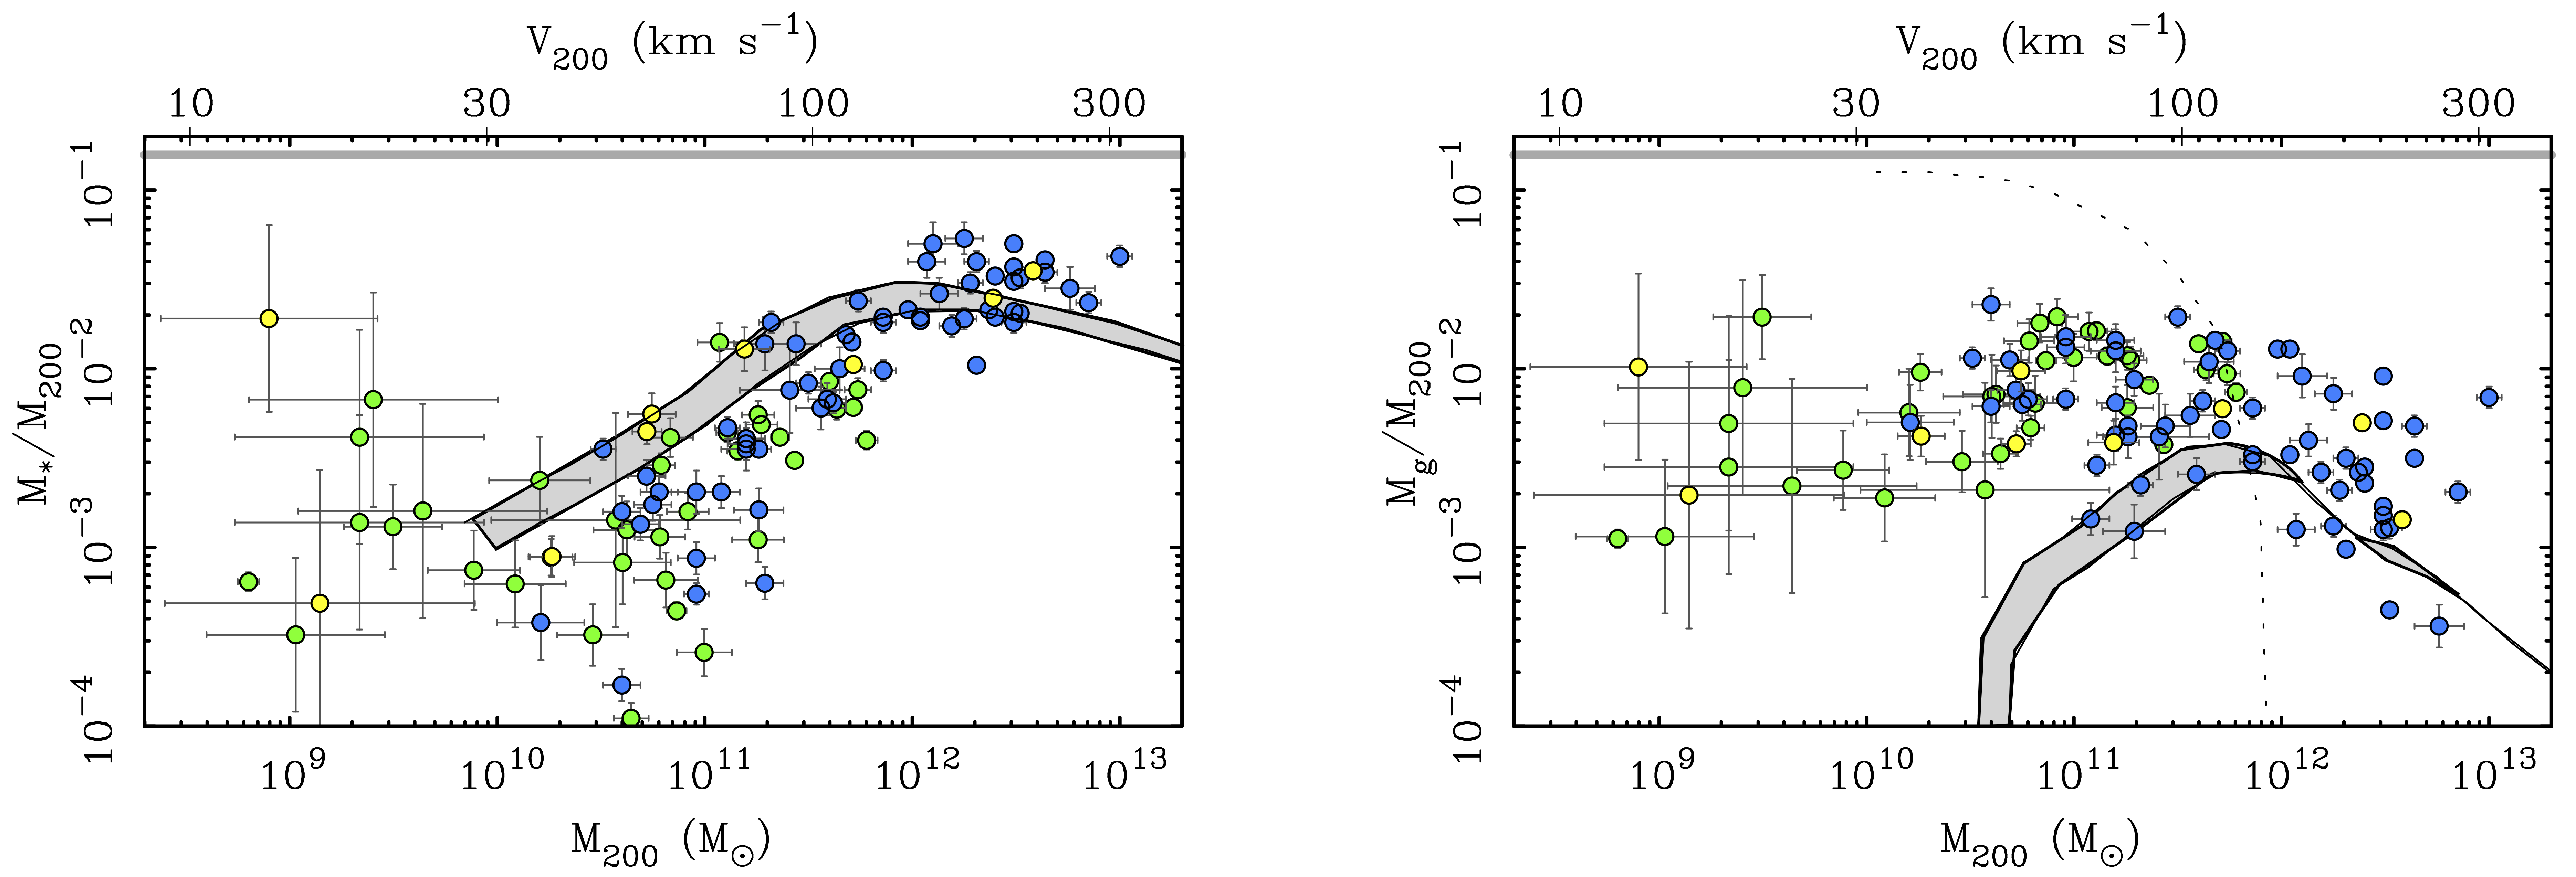
We are not able to directly test the fraction of baryons that are prevented from accreting or that are ejected to the IGM. We have only the vaguest of constraints on the CGM restricted to massive galaxies. But we do measure the stellar and ISM gas mass, so we can compare the EAGLE simulation above to the data:

To the eye habituated to astronomical accuracy, the stellar mass fraction in the left panel works out pretty well. The gray band representing the simulations does more or less the same thing as the data. However, this is one of the occasions on which we can fool ourselves with log-log plots. The bands are offset from the data by a factor that is not modest. The width of the bands already accounts for the plausible variation in the velocity fudge factor. One can of course consider implausible values of fv, but the shape is also a problem. If we make an adjustment to match intermediate mass galaxies, the difference from high mass galaxies gets worse. One could make further tweaks, but this is a hopeless game as the shape problem stems from the curvature that is inevitable in abundance matching relations and the lack thereof in Tully-Fisher.
The gas content of EAGLE simulated galaxy-like objects does not compare well to the observed ISM in real galaxies (right panel). Gas is historically the hardest part to do in large magnetohydrodynamical cosmological simulations, so I’ve cut simulators a lot of slack, only occasionally pointing out that this doesn’t work out. But it really doesn’t work out, so if they want me to cut them slack then they should refrain% from asserting that everything works out. It has become a tiresome, decades-long refrain that has never panned out.
The problem for cold ISM gas in massive galaxies in EAGLE is that there isn’t enough of it. The problem in intermediate mass galaxies is that there really isn’t enough of it. The typical value is off by an order of magnitude at M200 ~ 1011 M☉. The problem in low mass galaxies is that it isn’t there at all. They typical EAGLE object with M200 < 1010.5 M☉ has no cold gas at all. Such objects should not exist, apparently. But gas rich, low masses galaxies are boilerplate examples of observational reality, so it is a substantial problem for a simulation if such things are predicted to be rare$.
There are many other LCDM simulations on the market. At most one of them can be correct. EAGLE is a reasonable example for illustrating what galaxy formation should plausibly do. Though not perfect, it is a reasonable representative of the LCDM brand. In this context, it makes sense to me that there would be all these various baryonic components and reservoirs. But reality doesn’t look like that. We add up the stars and cold gas and we’re done; anything extra involves fine-tuning. Maybe there should be more stuff associated with galaxies, but the fine-tuning problem this entails augers otherwise.
*I started to say a lot more about this here, but decided it was too deep a rabbit hole, so instead refer to a note about a conversation I had with Colin Norman on what the reionization scale should be.
%The sociology in the simulation community seems to be to assert complete success in explaining everything at all times until the next batch of simulations completes running, then point out all the improvements. Everything is explained all the time, only more so as time goes on.
$There is one caveat of comparing apples and oranges. The galaxies for which we have gas data are generally blue, late type (mostly dwarf irregular) galaxies. So we should make this comparison to similar objects in the simulation, but this distinction was not made by Mitchell & Schaye (2022). Persisting in my habit of giving the LCDM paradigm every benefit of the doubt, one can imagine that there is an as-yet undiscovered population of very low surface brightness galaxies that are red and gas poor pervading the universe, and that EAGLE is predicting these things are out there waiting to be discovered. The gas fractions are low because there are a lot of gas poor galaxies that we haven’t discovered yet. Having spent much of my career seeking low surface brightness galaxies, I’ve never been disappointed that there are more of them out there. I have, however, routinely been disappointed that there are enough of them to solve huge numerical discrepancies like this.
Additional details
Description
Our cosmology du jour, LCDM, suffers a local missing baryon problem: we don't detect all of the baryons we expected to find associated with the dark matter halos of individual galaxies. Should we? Empirically, yes.
Identifiers
- GUID
- https://tritonstation.com/?p=12698
- URL
- https://tritonstation.com/2026/06/18/local-baryons-in-simulations-and-reality/
Dates
- Issued
-
2026-06-18T21:38:43
- Updated
-
2026-06-18T21:38:44