
MetWare screenshot: spectrum support #2

As promised yesterday , here's the pretty visualization of the mass spectrum, using JavaScript from the PRIDE project:
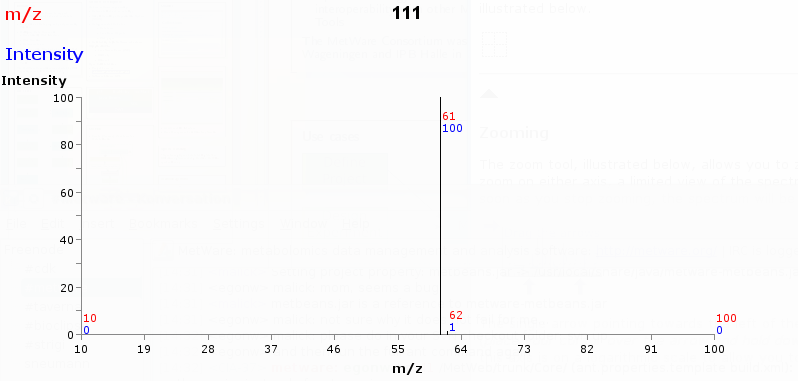
Note the manual adding of peaks at 10 and 100 m/z to get the real peaks somewhere in the middle instead of on the left and right border of the graph.
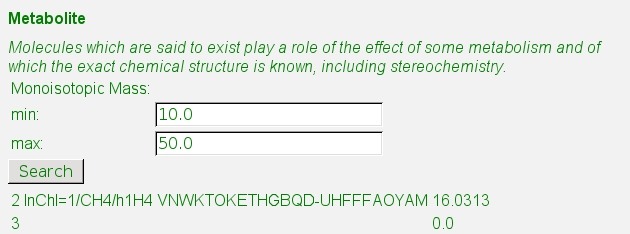
Meanwhile, the search page is now autogenerated too, and the types of searches allowed (min, max in the picture) again depends on the XML Scheme data type defined in the MetWare SKOS:
Additional details
Description
As promised yesterday , here's the pretty visualization of the mass spectrum, using JavaScript from the PRIDE project:
Identifiers
- GUID
- https://doi.org/10.59350/5gzjj-p9s54
- URL
- https://chem-bla-ics.linkedchemistry.info/2008/08/21/metware-screenshot-spectrum-support-2.html
Dates
- Issued
-
2008-08-21T02:00:00
- Updated
-
2025-10-11T02:00:00